Introduction
The national temperature, rainfall, sunshine and dust haze conditions for Trinidad and Tobago from 1946 to 2021 are shown on this page in graphical and tabular formats. The purpose of the graphs and tables is to highlight the long-term averages and extremes of Trinidad and Tobago climate record.
The long-term average, known as the climatological normal, shows the latest set of 30-year averages, covering the period 1991-2020, for the reference climatological stations at Piarco, Trinidad and Crown Point, Tobago.
Copyright and Contact Information
Please note that the copyright for any data supplied by the Trinidad and Tobago Meteorological Service is held in the Republic of Trinidad and Tobago and the user shall give acknowledgement of the source in reference to the data, graphic and information. The users shall not reproduce (electronically or otherwise), modify or supply these graphic, data, or information as if it were their own.
Averages
These graphs show the average annual, seasonal and monthly temperature, rainfall distribution, extreme values and ranking across Trinidad and Tobago. These values can be used to provide an estimate of what is most likely to happen. The averages for various annual, seasonal and monthly time periods are calculated over the period 1991 to 2020.
Temperature Climatology
| Long-term Average Monthly Temperatures (°C) |
Long-Term Average Monthly Day-Maximum and Night-Minimum Temperatures (°C) |
 |
 |
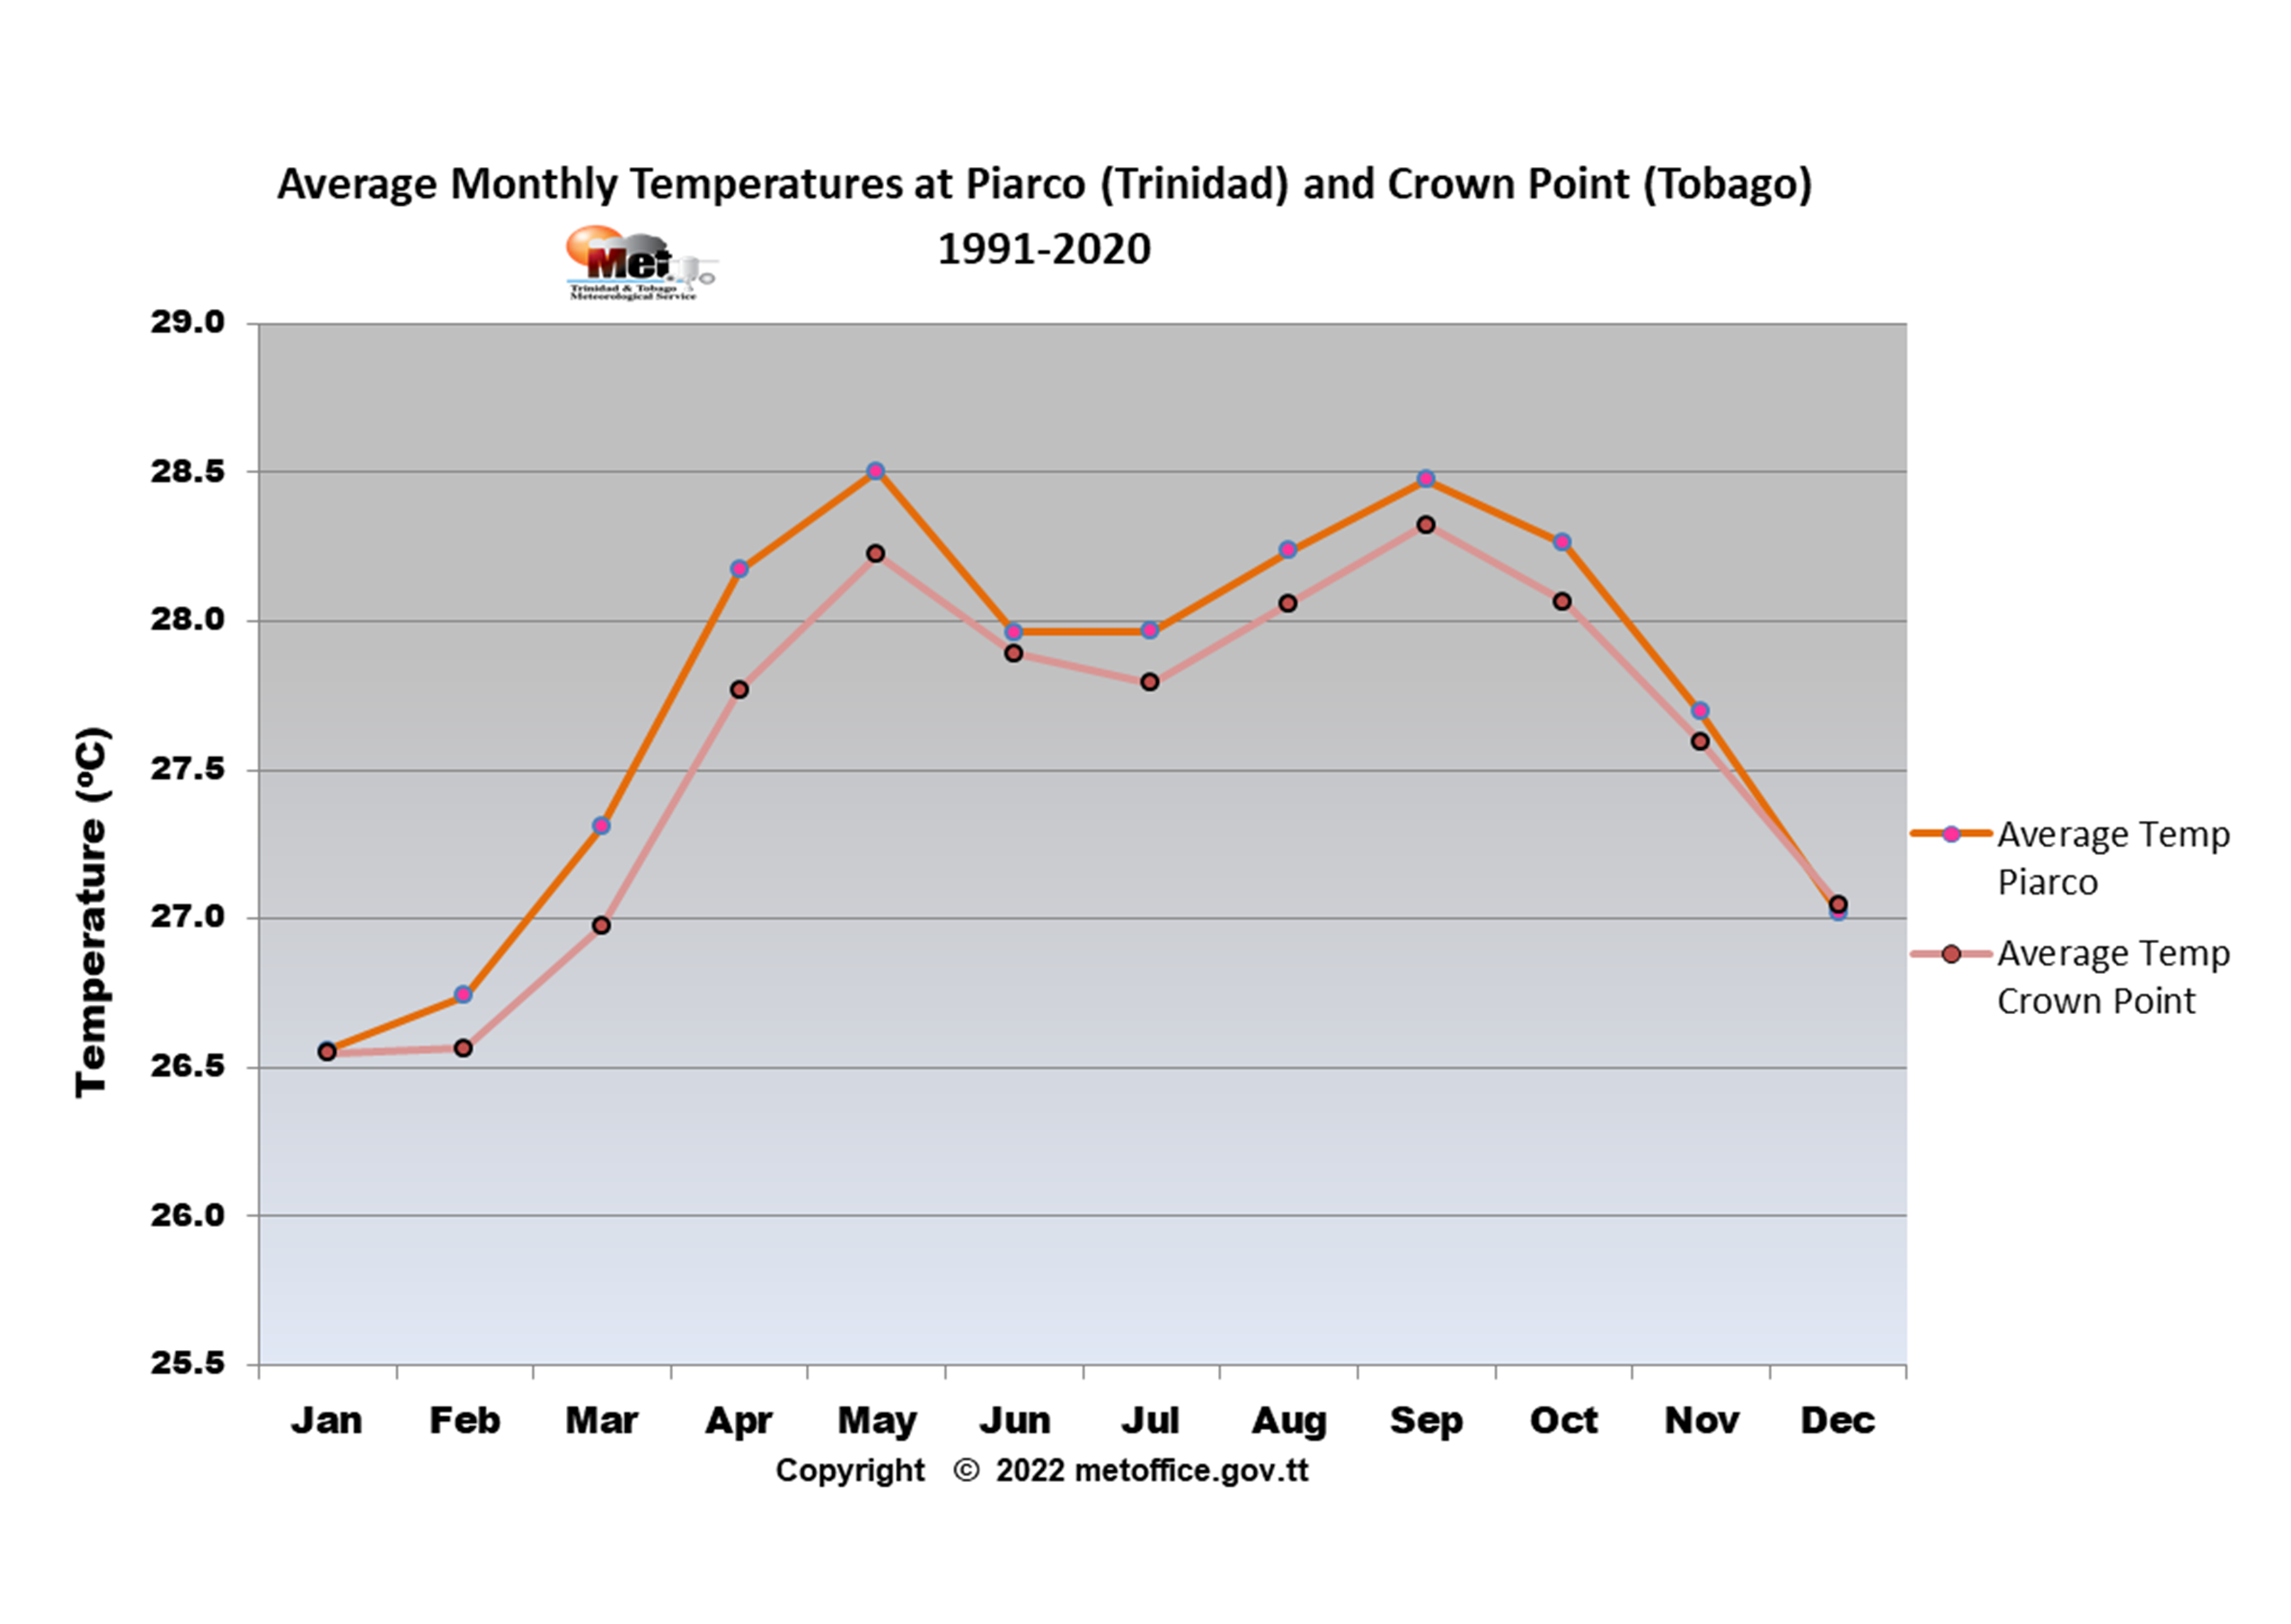
| At the national climate reference stations located at Piarco, Trinidad and Crown Point, Tobago, for the climate reference period 1991 -2020. May and September are the warmest months in terms of daily average temperatures. February is the coolest month. |
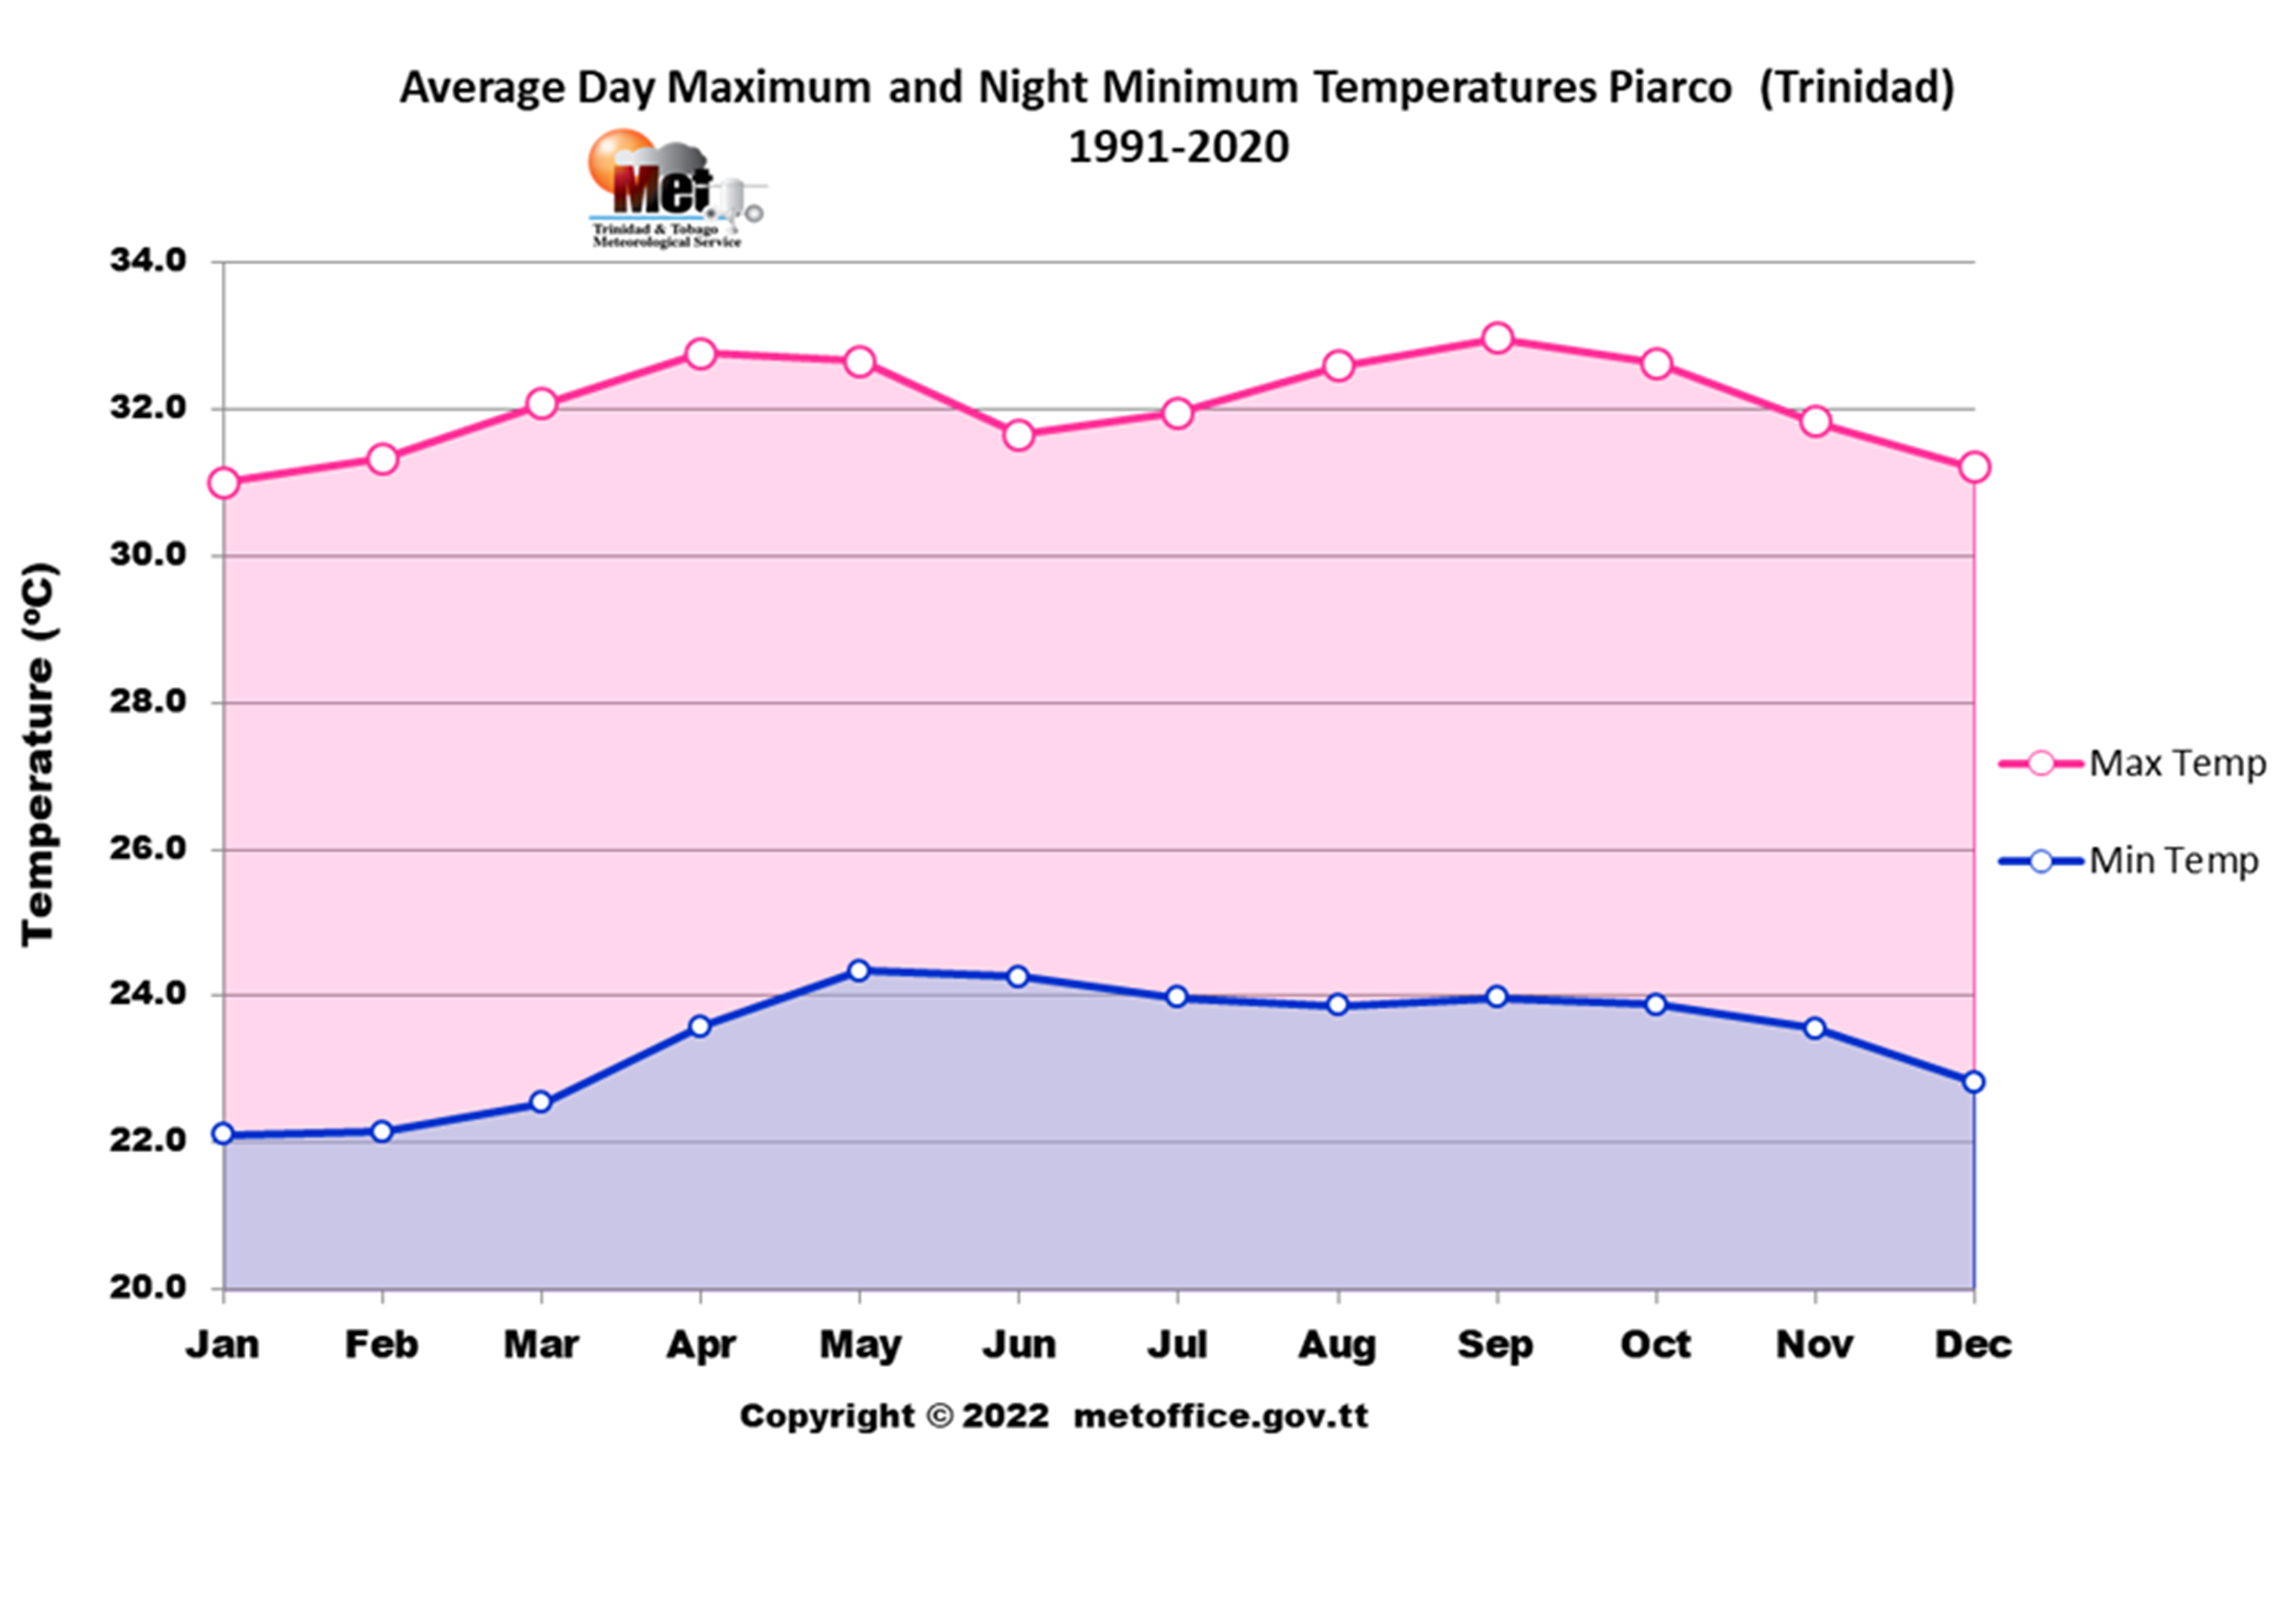
At Piarco for the climate reference period 1991-2020. In terms of daily maximum average temperatures, September is the warmest month, with an average maximum temperature of 33.0°C, followed by April with an average maximum temperature of 32.8°C. The months of May and June share average minimum night temperatures of 24.3°C and have the warmest nights on average. |
| Long-Term Average Monthly Day-Maximum and Night-Minimum Temperatures (°C) |
National Monthly Record of Warmest Daily Maximum Temperatures and Coolest Minimum Temperatures (°C) |
 |
 |
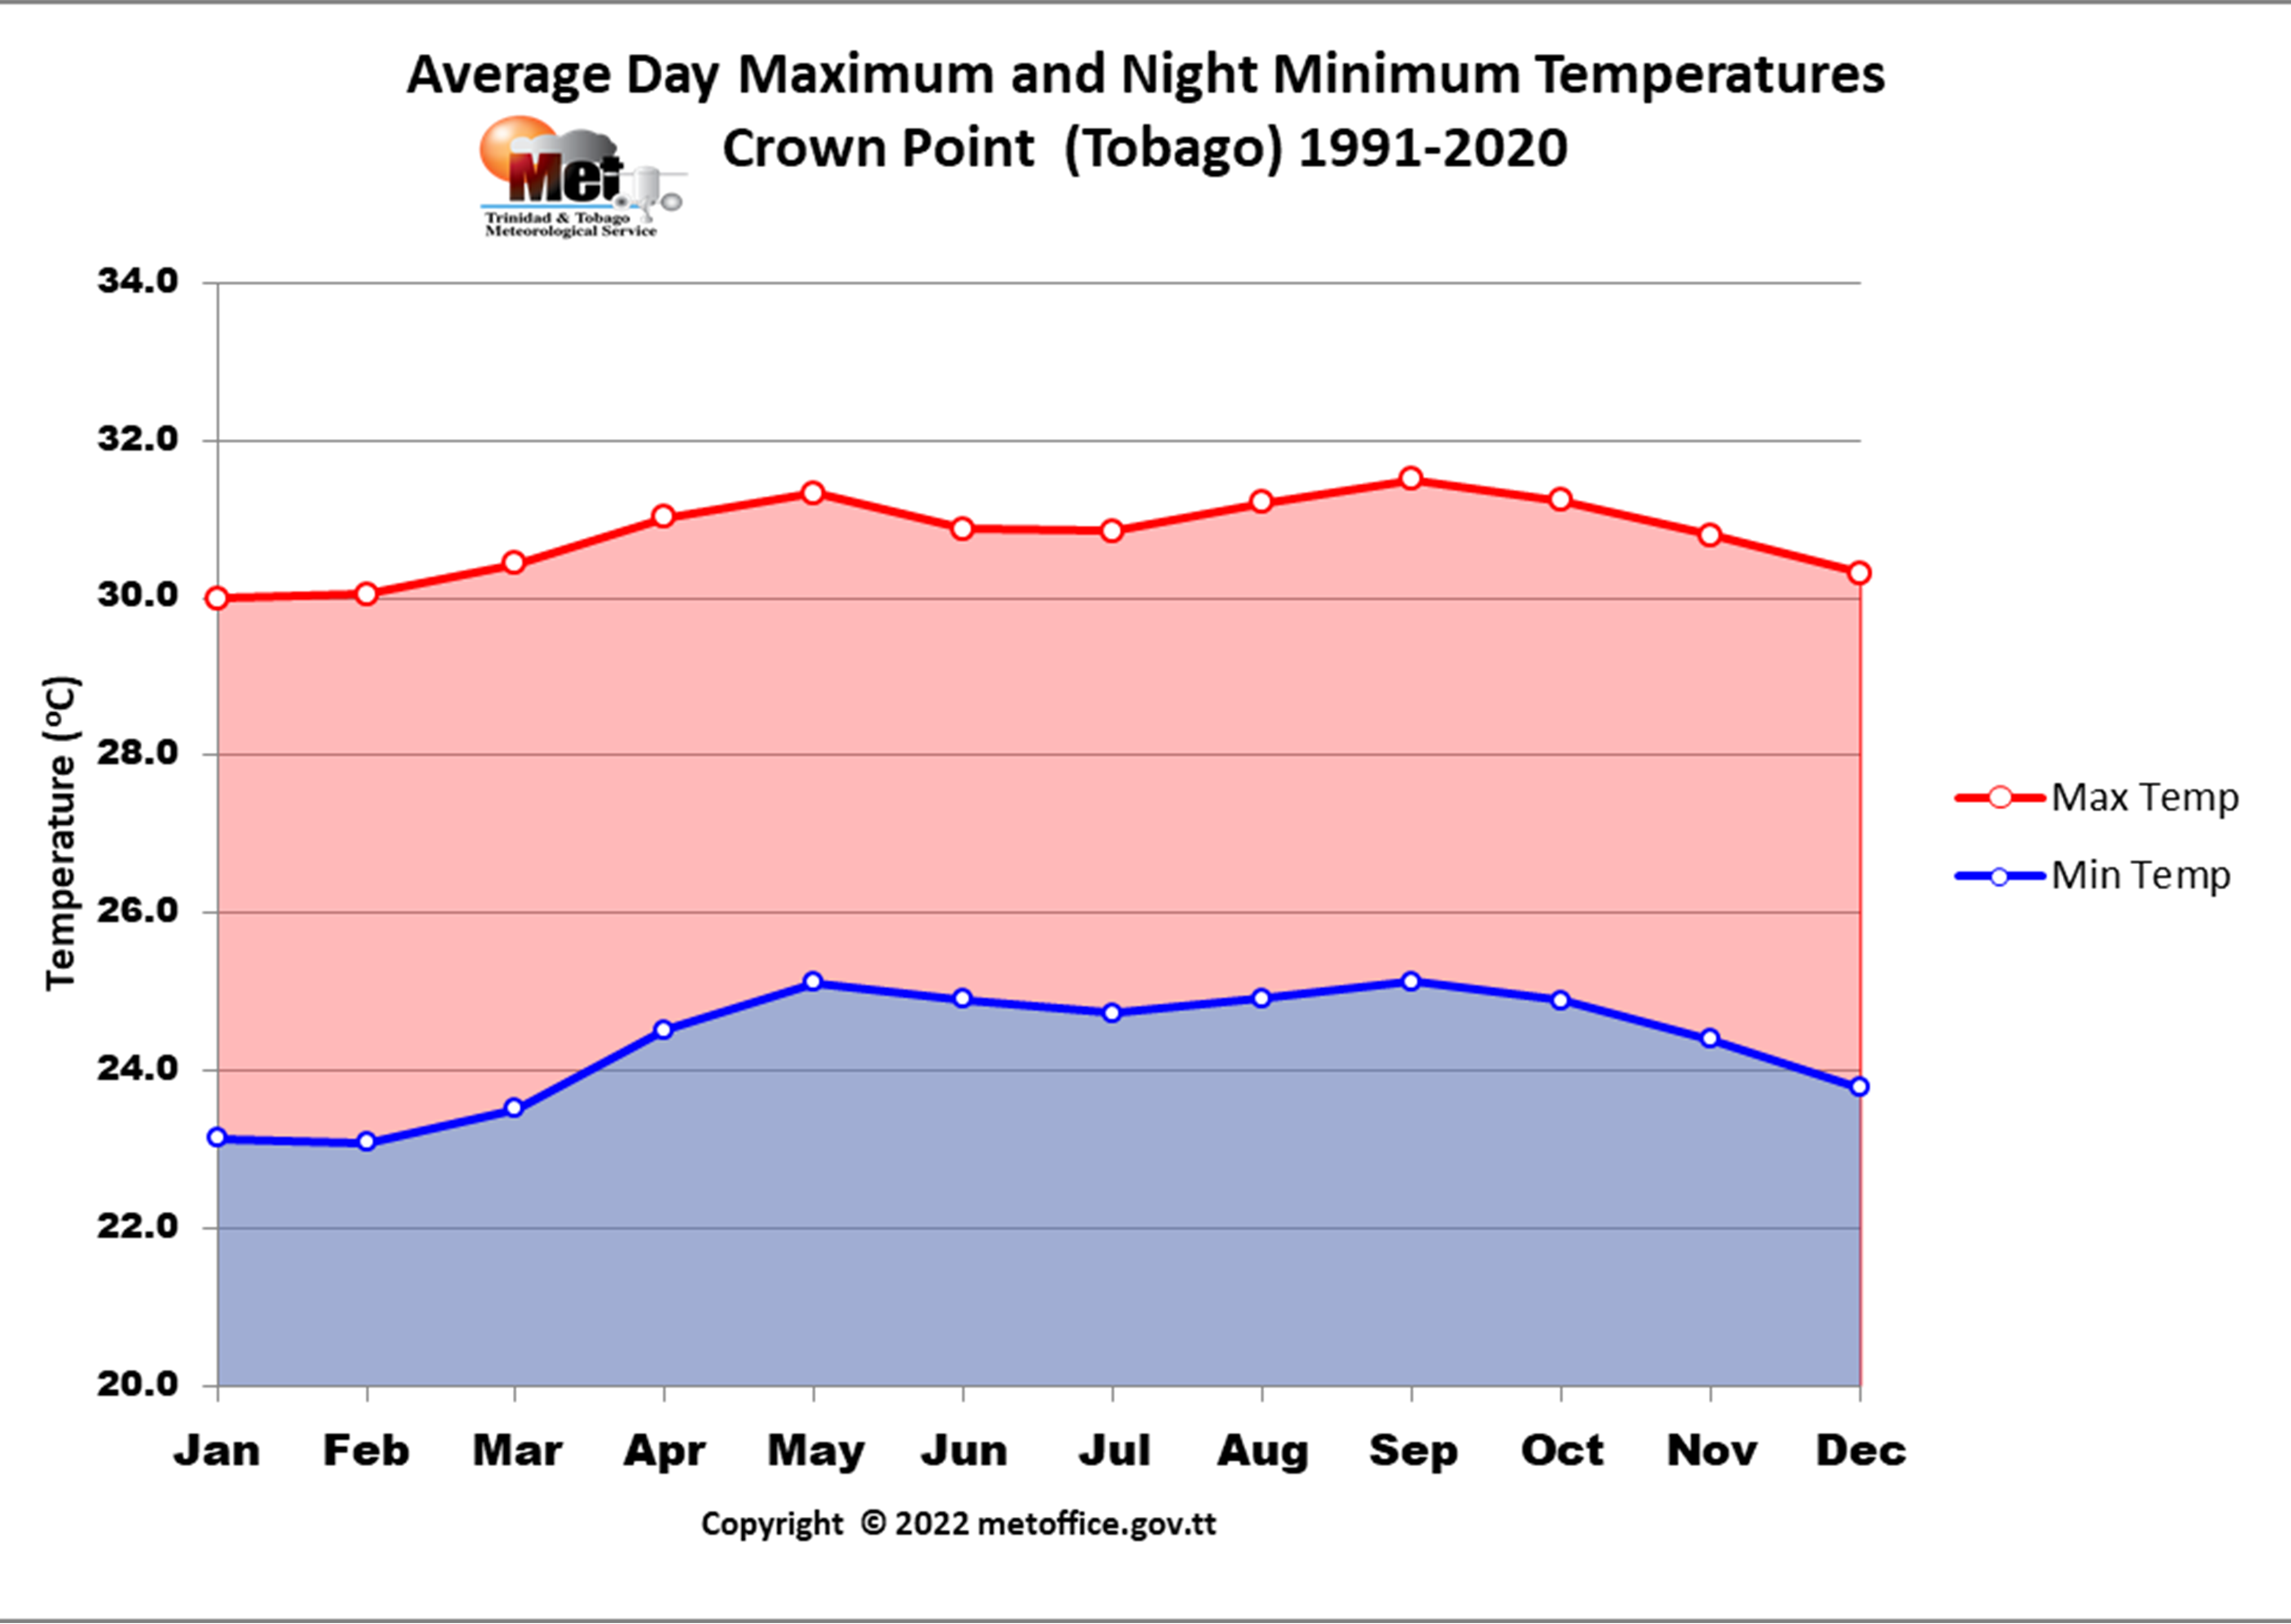
| At Crown Point for the climate reference period 1991-2020. September is the warmest month, in terms of daily maximum average temperatures, with an average maximum temperature of 31.5°C followed by May with an average maximum temperature of 31.3°C. May and September with average minimum night temperatures of 25.1°C have the warmest nights on average. |
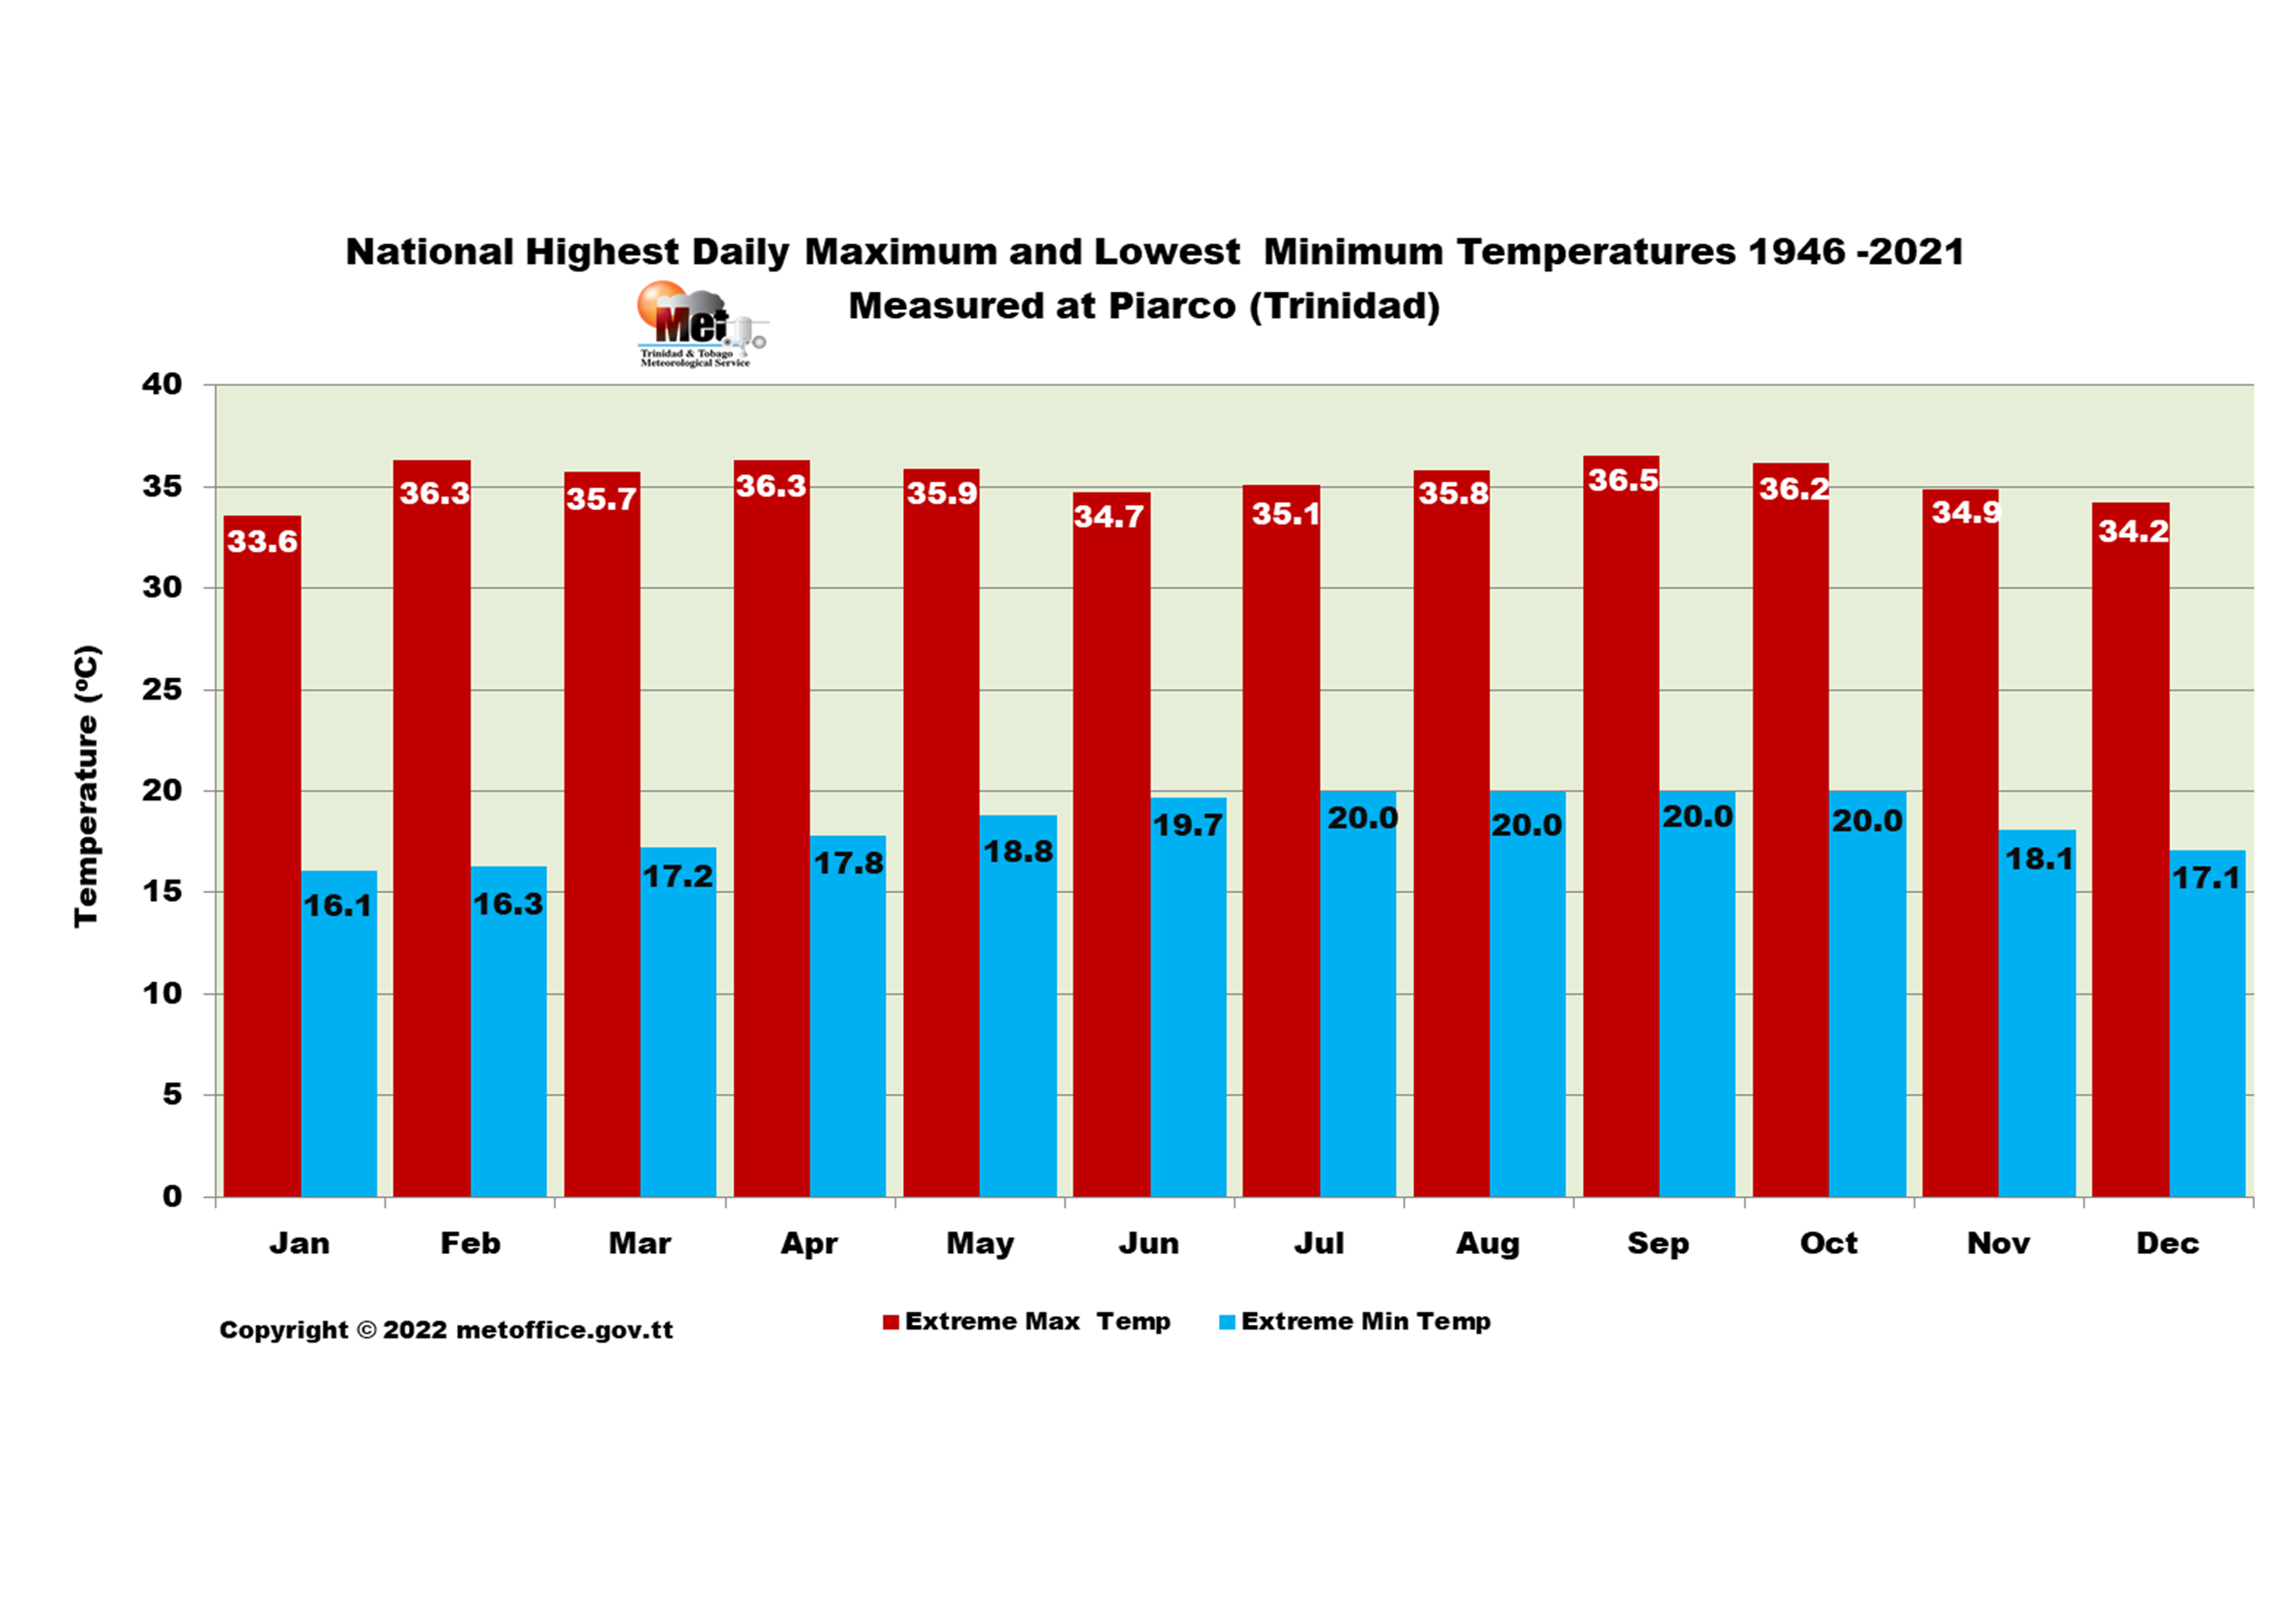
Measured at Piarco from 1959 to 2021. The warmest maximum daily temperature recorded nationally is 36.5°C, which occurred on September 25th, 1990 at Piarco. The coolest minimum temperature is 16.1°C, which occurred on January 21st and 30th, 1964 at Piarco. |
| Highest and Lowest Extreme Daily Maximum and Minimum Temperatures (°C) |
| Month |
Jan |
Feb |
Mar |
Apr |
May |
Jun |
Jul |
Aug |
Sep |
Oct |
Nov |
Nov |
| Max Temp |
33.6 |
36.3 |
35.7 |
36.3 |
35.9 |
34.7 |
35.1 |
35.8 |
36.5 |
36.2 |
34.9 |
34.2 |
| Date |
17/2012 |
25/2010 |
8/2010 |
16/2016 |
11/2010 |
22/2010 04/1999 |
29/1999 |
23/2017 |
25/1990 |
17/2016 19/2016 |
8/2008 |
21/2010 |
| Extreme Min Temp |
16.1 |
16.3 |
17.2 |
17.8 |
18.8 |
19.7 |
20 |
20 |
20 |
20 |
18.1 |
17.1 |
| Date |
21/1964 30/1964 |
24/1979 |
2/1962 |
15/1976 |
4/1967 |
23/1971 |
9/1961 |
7/1965 15/1965 |
2/1974 |
15/1976 |
17/1970 |
29/1975 |
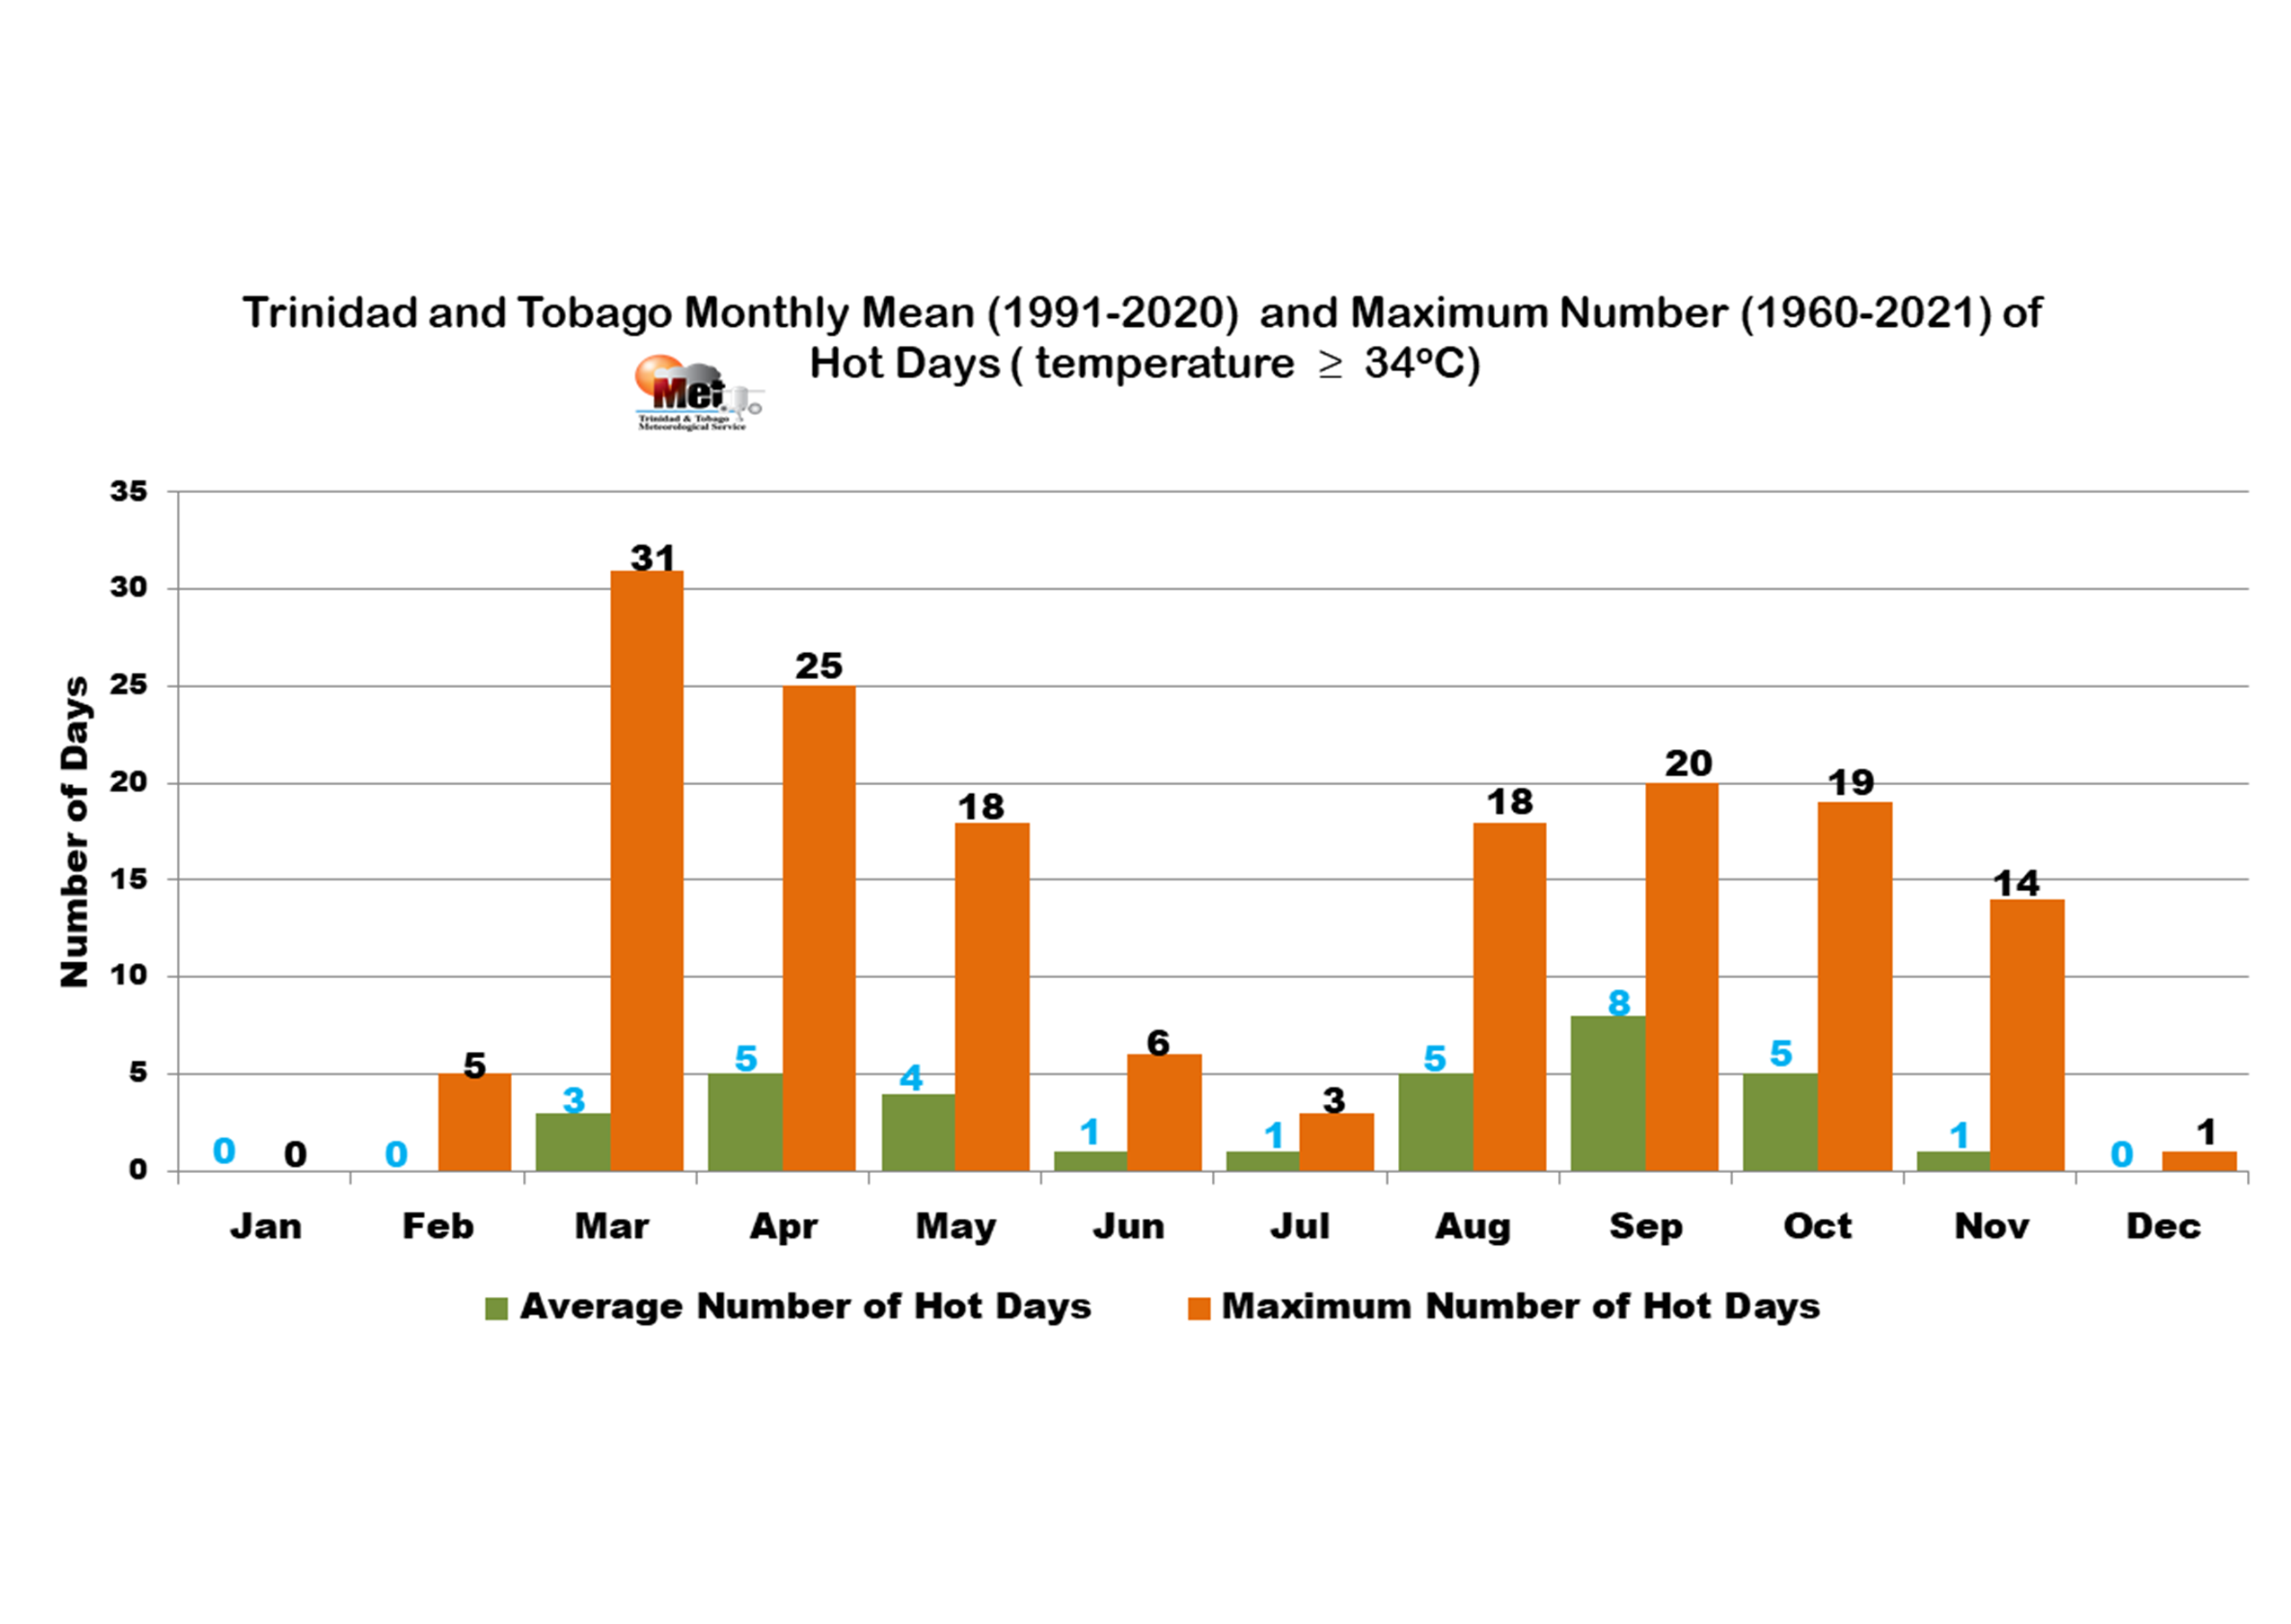
| Local Heat Season in Trinidad and Tobago (Hot Days) |
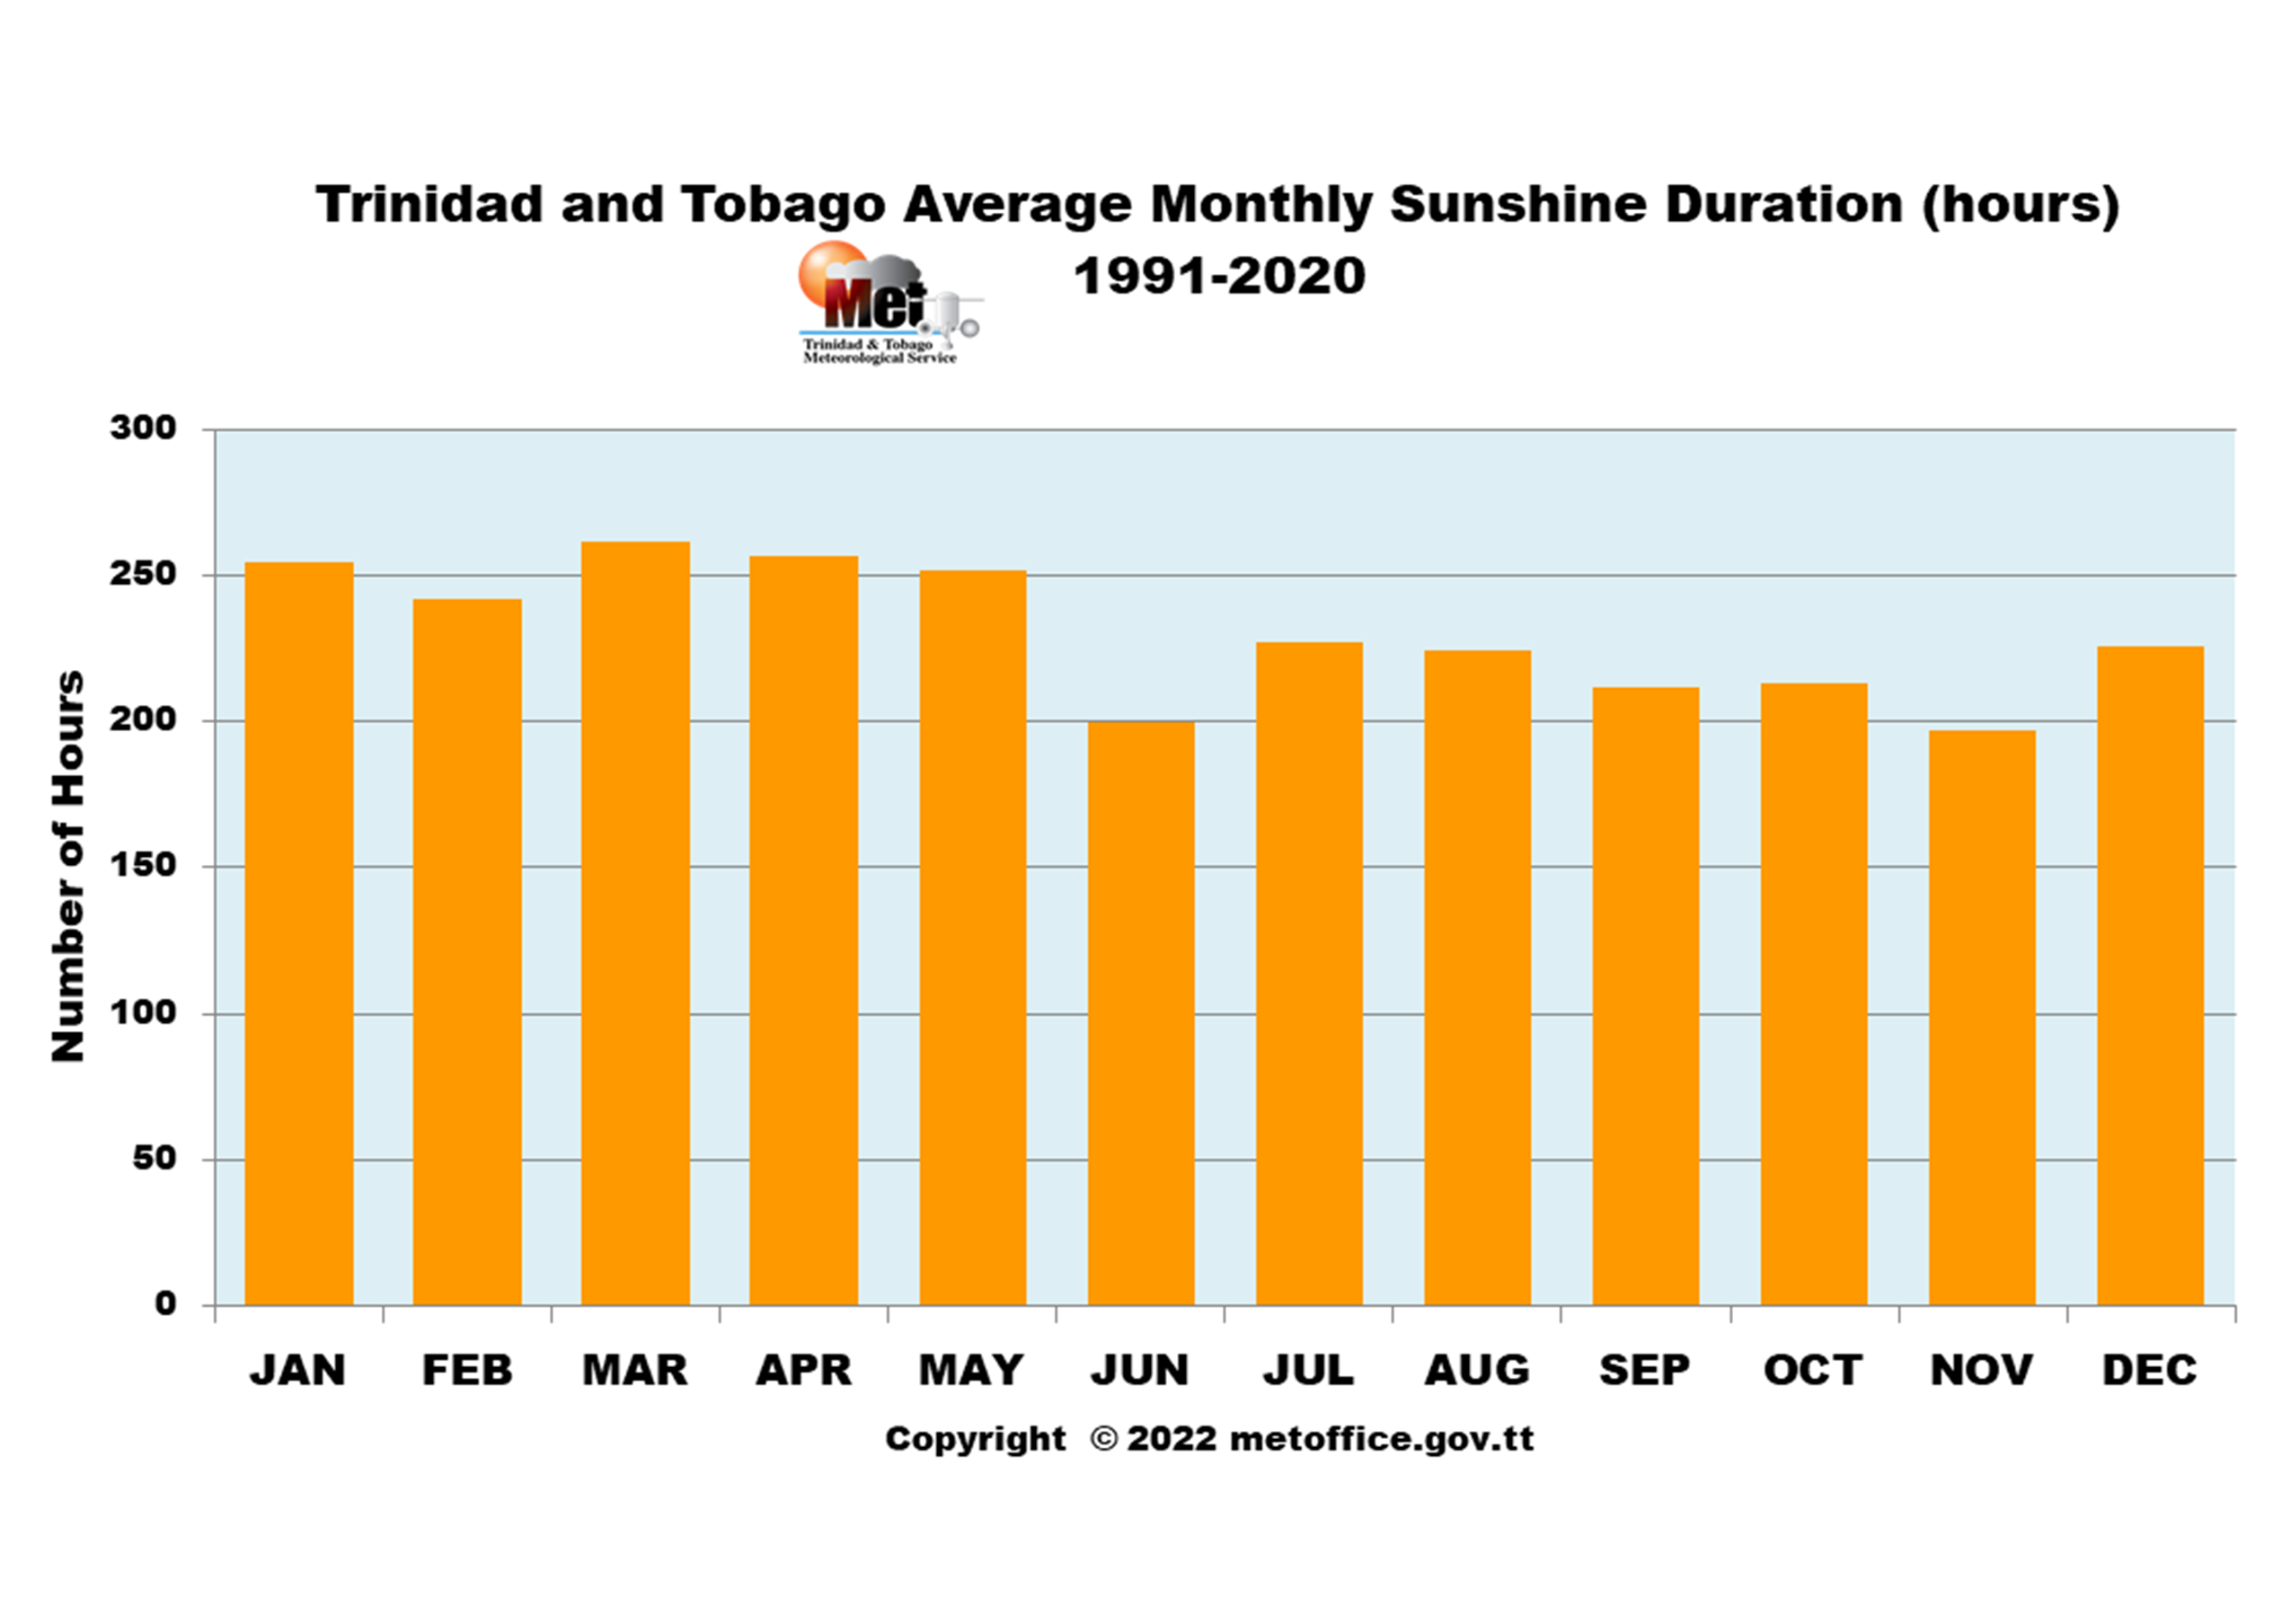
Average Annual Sunshine Totals (Hours) |
 |
 |
| The local heat season in Trinidad and Tobago is defined by the period with the highest frequency of hot days in the record. Hot days are days when the maximum temperature reach or exceed the 95th percentile, which is 34.0°C. Typically, Trinidad and Tobago heat season occurs from March to October, with the hottest weather and the most excessive heat occurring during April to May and August to October, which are the peaks of the local heat season. |
Trinidad and Tobago average (1991-2020) annual sunshine total is 2766 hours. On average, the sunniest month is March, with a monthly average of 261.5 sunshine hours, followed by April with 256.6 hours. November is the least sunny month, with average sunshine hours of 197.2 hours. The sunniest month on record is March 2010 with 319.5 sunshine hours. The least sunny month on record is June 1982 with 104 sunshine hours. |
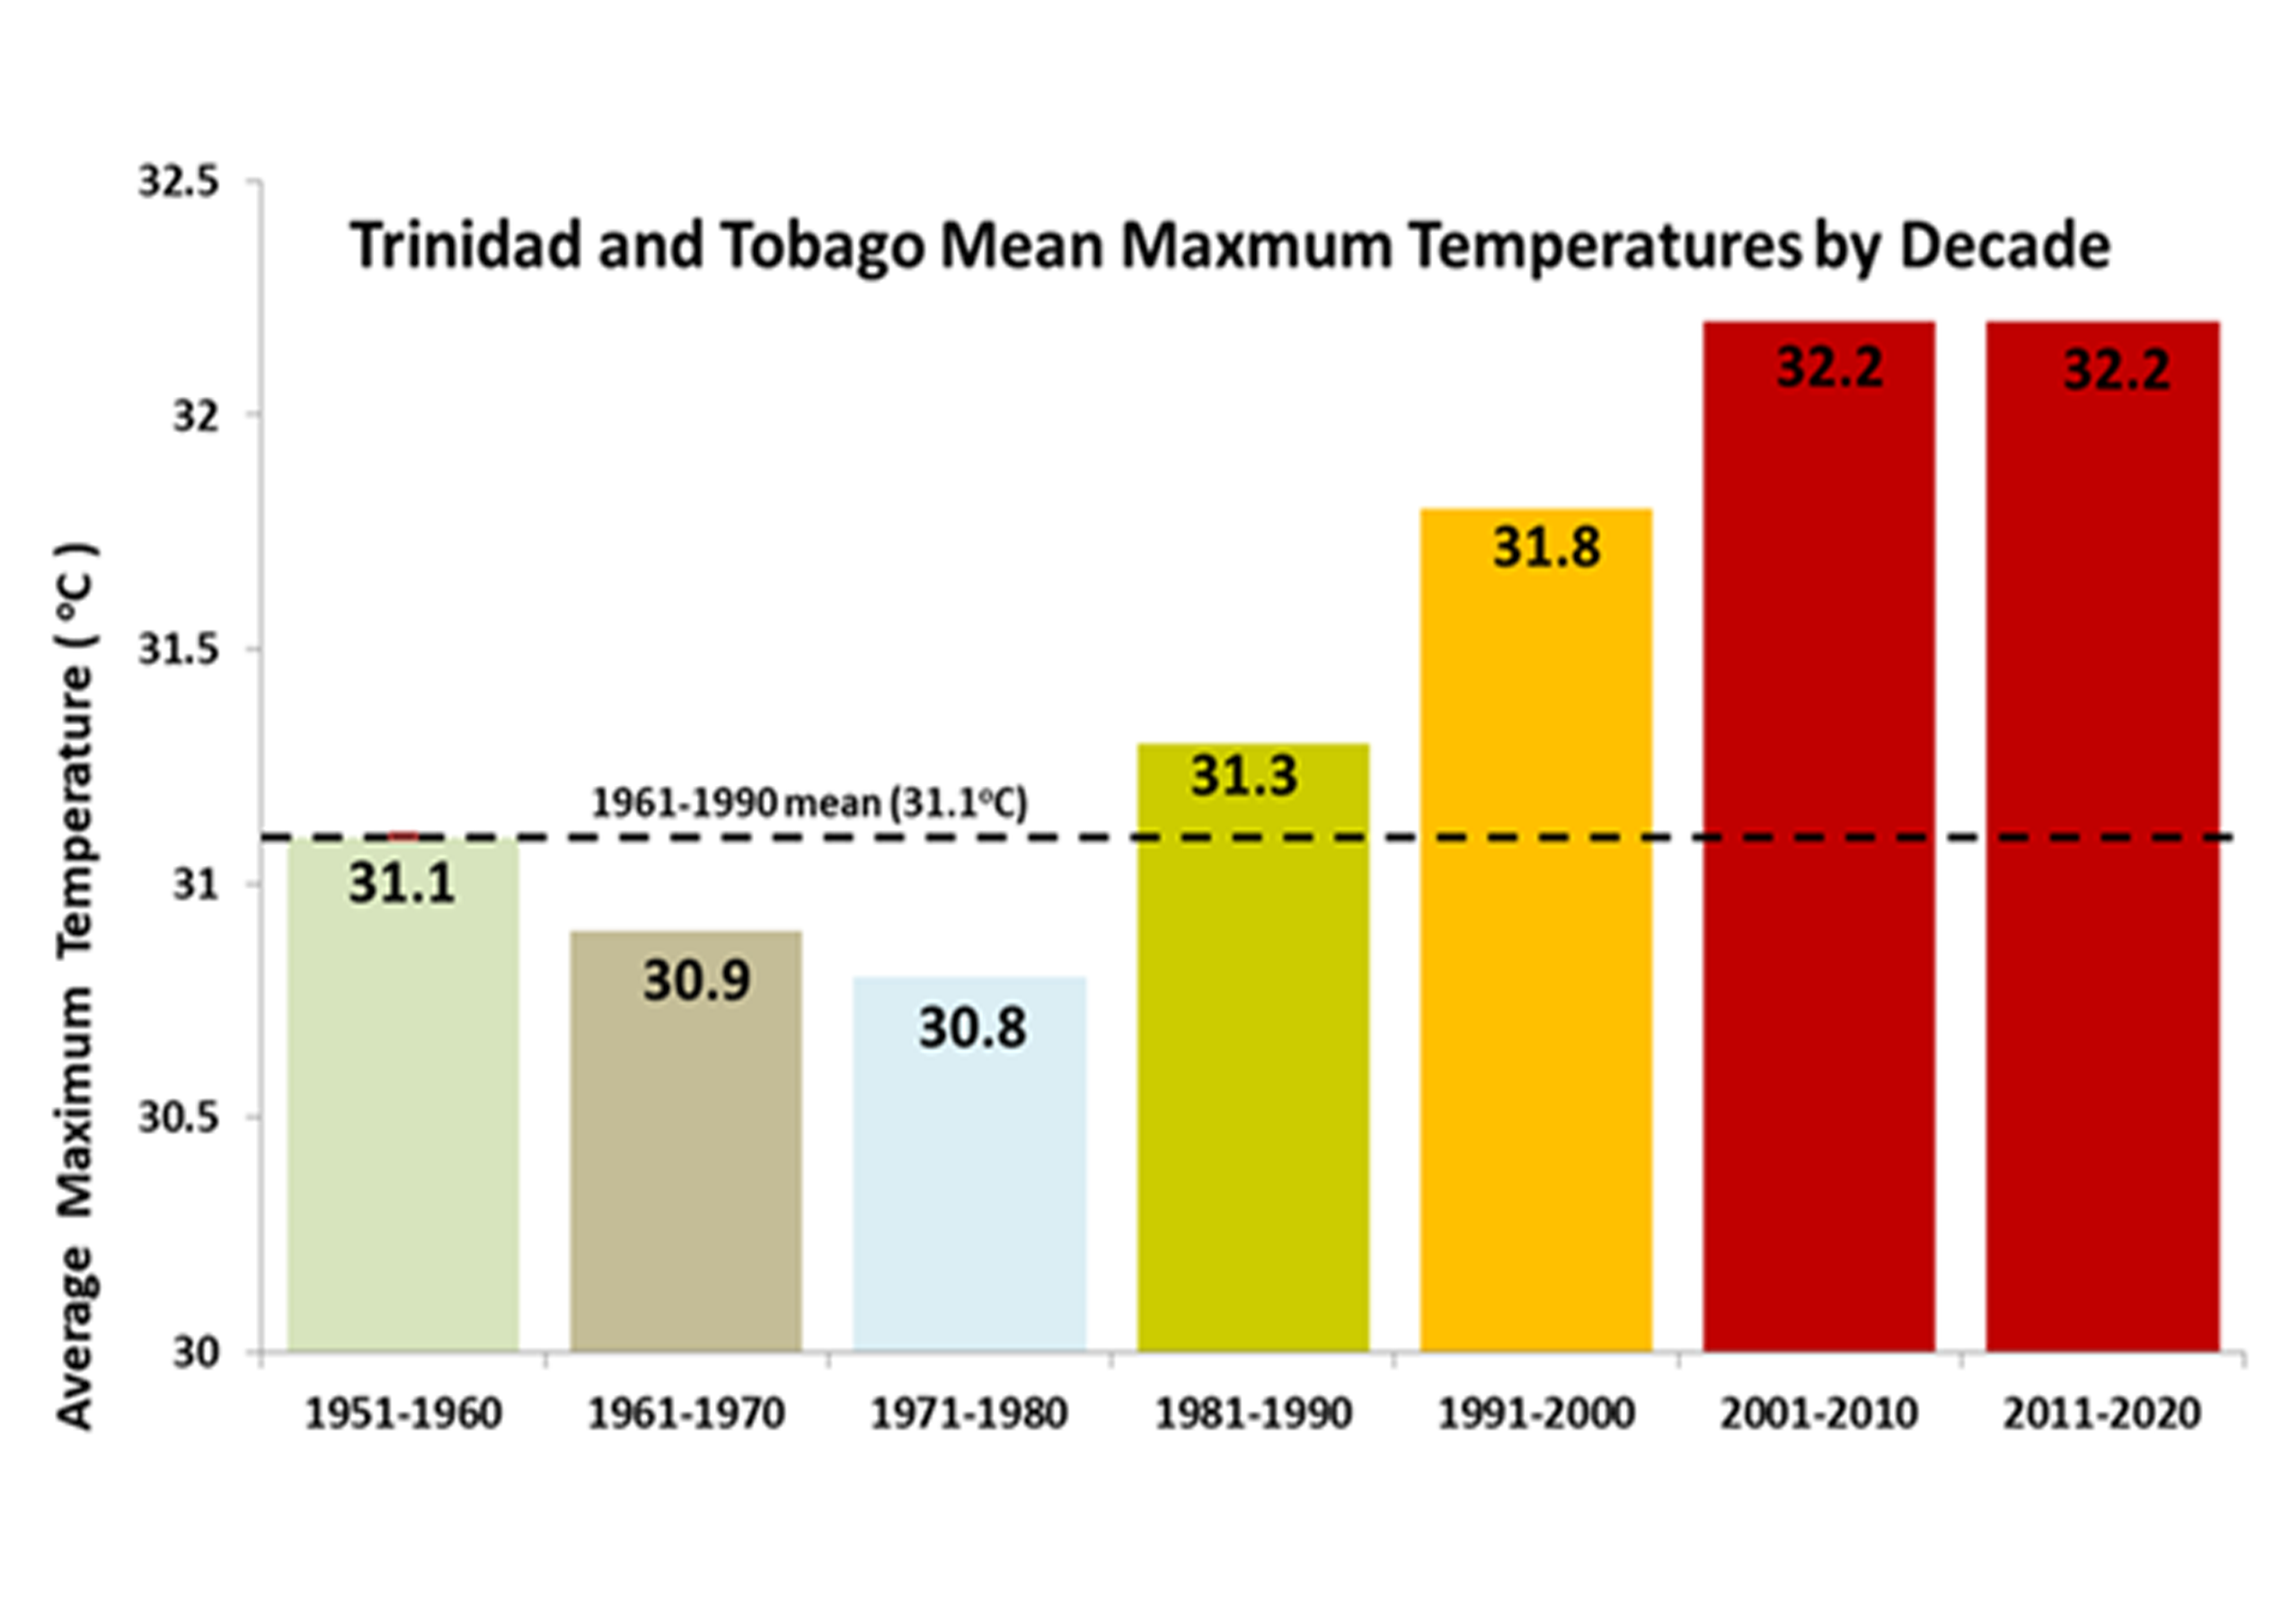
| Change in Trinidad and Tobago Decadal Average Daily Maximum Temperature (ºC) Between 1951 and 2020 |
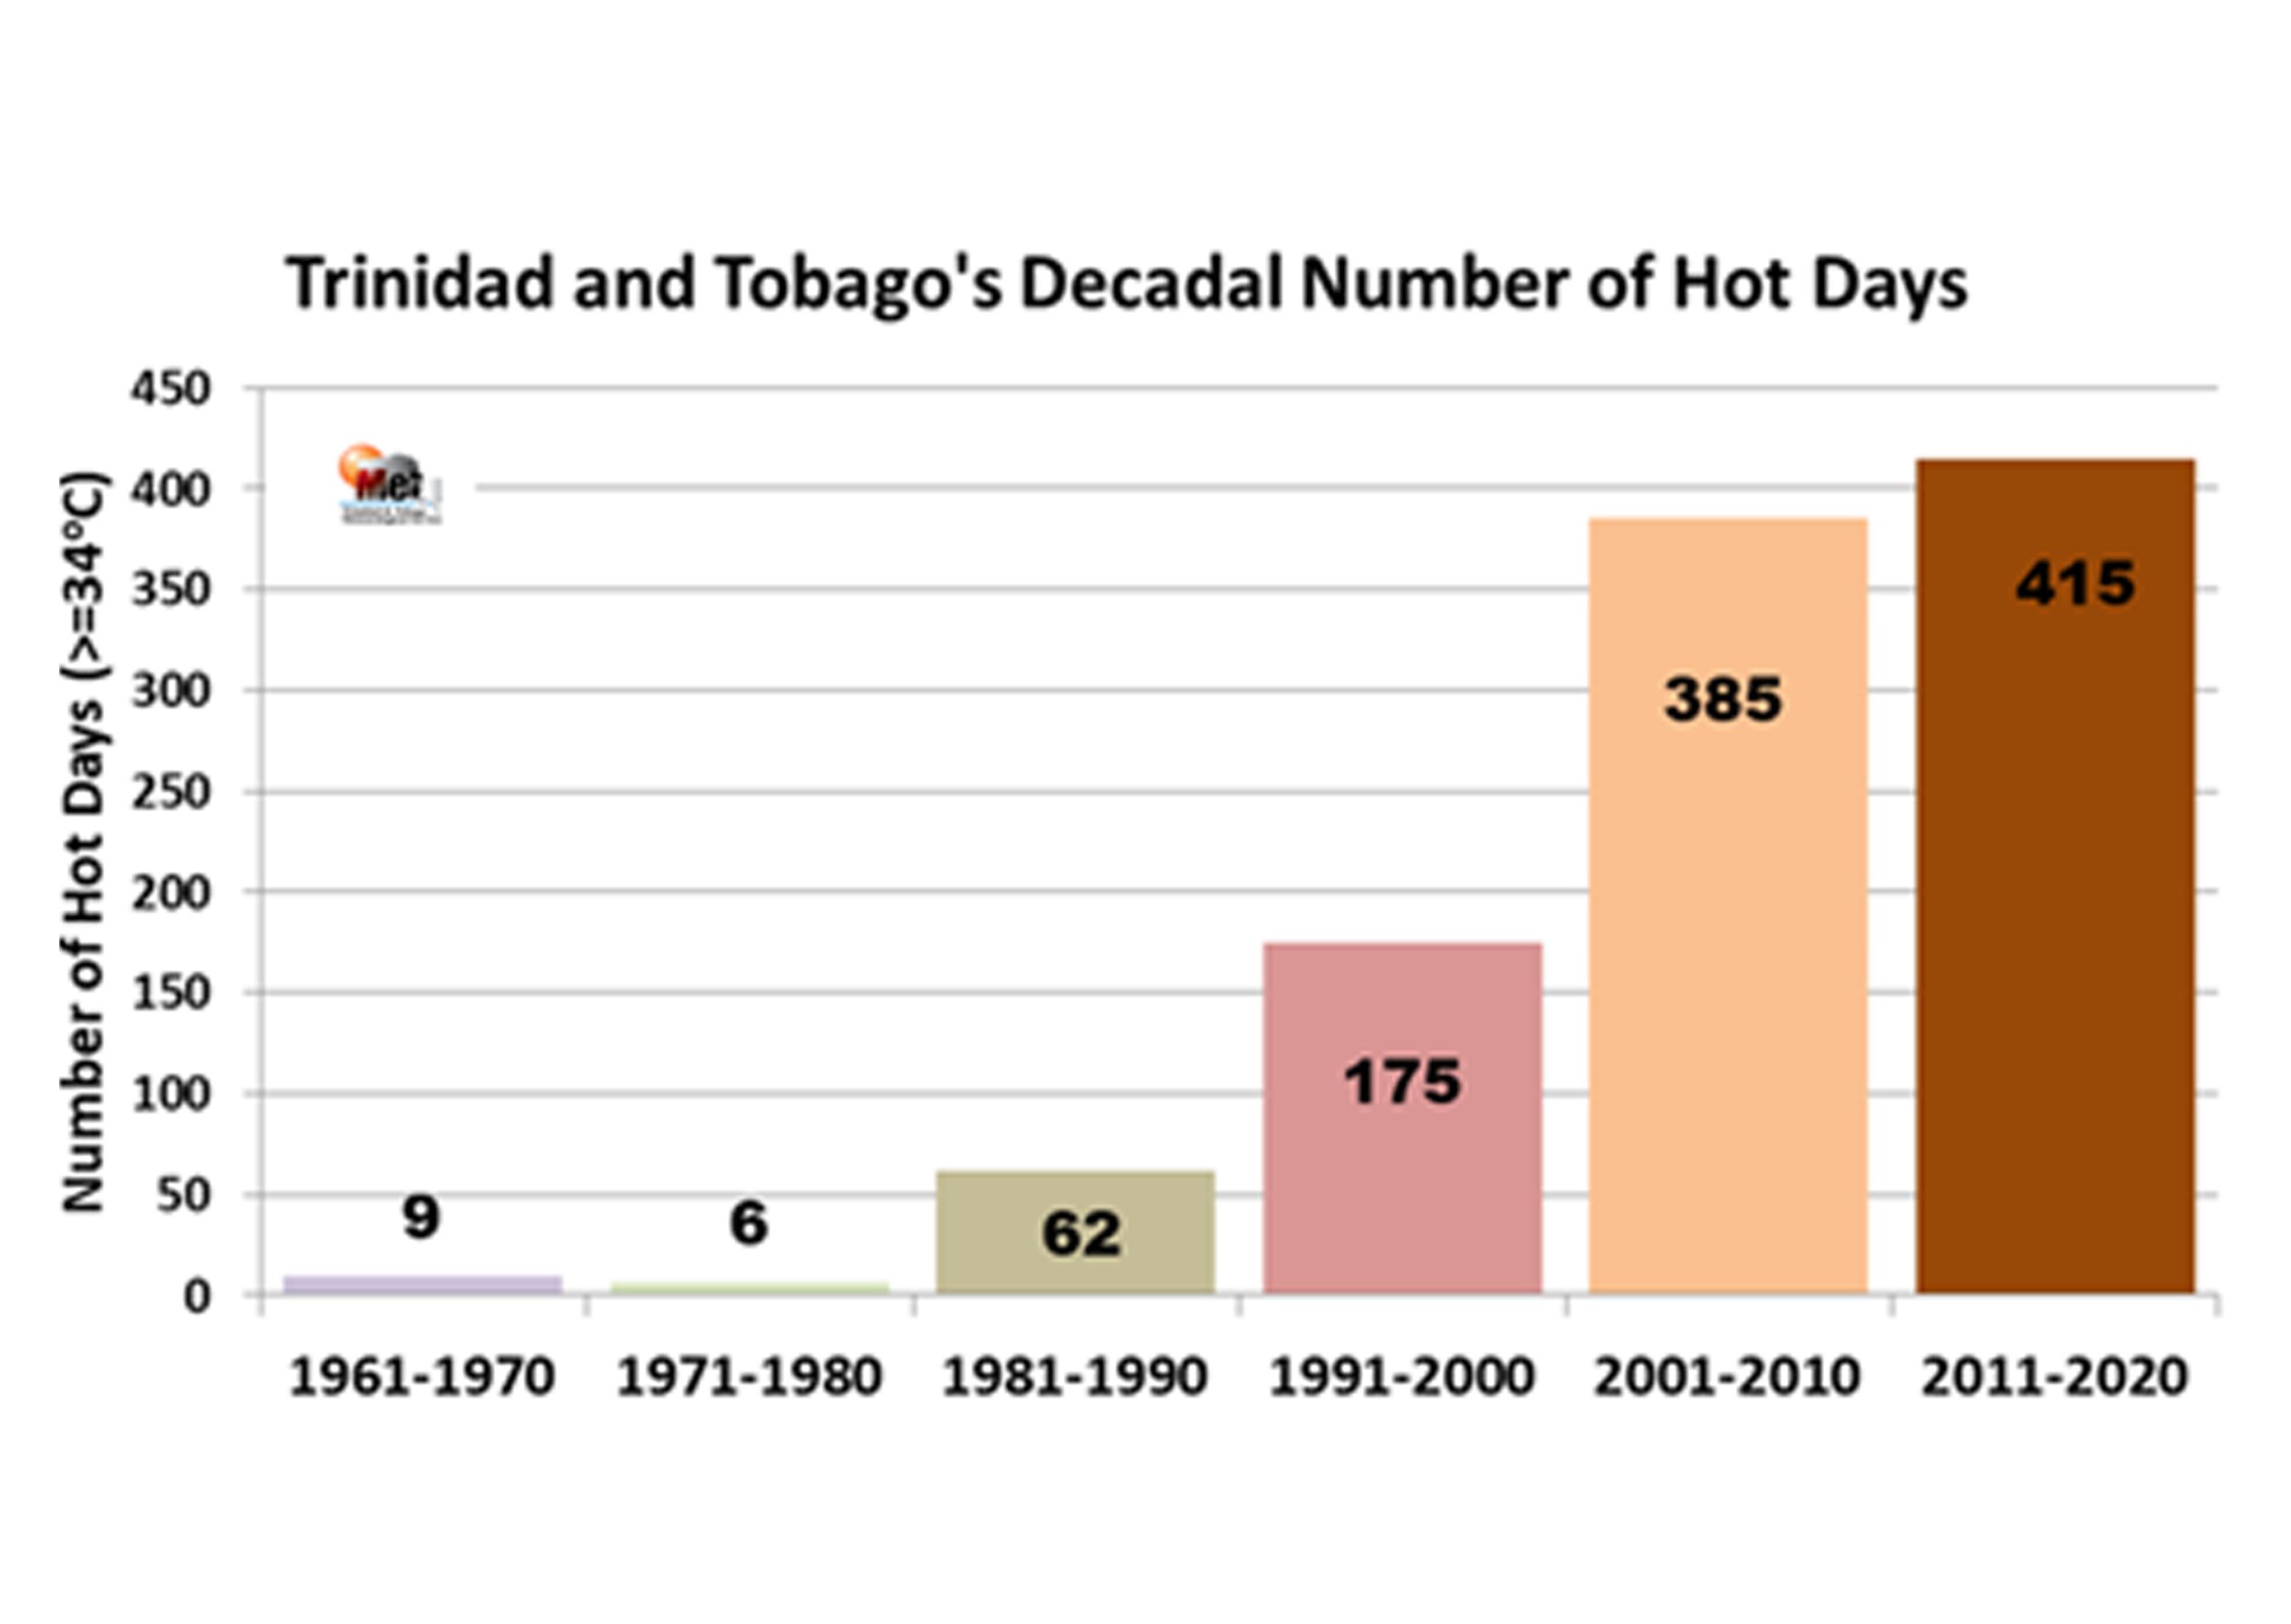
Changes in Decadal Hot Days in Trinidad and Tobago from 1960-to 2020 |
 |
 |
| Decadal average daily maximum temperatures at Piarco, Trinidad have risen by about 1.1 ºC. |
The graphic shows the decadal trend in hot days in Trinidad and Tobago from 1960-to 2020. A hot day is a day when the maximum temperature equals or exceeds 34°C (the 95th percentile). Hot days in the last decade have occurred more than twice the amount of hot days in the 1990s. |
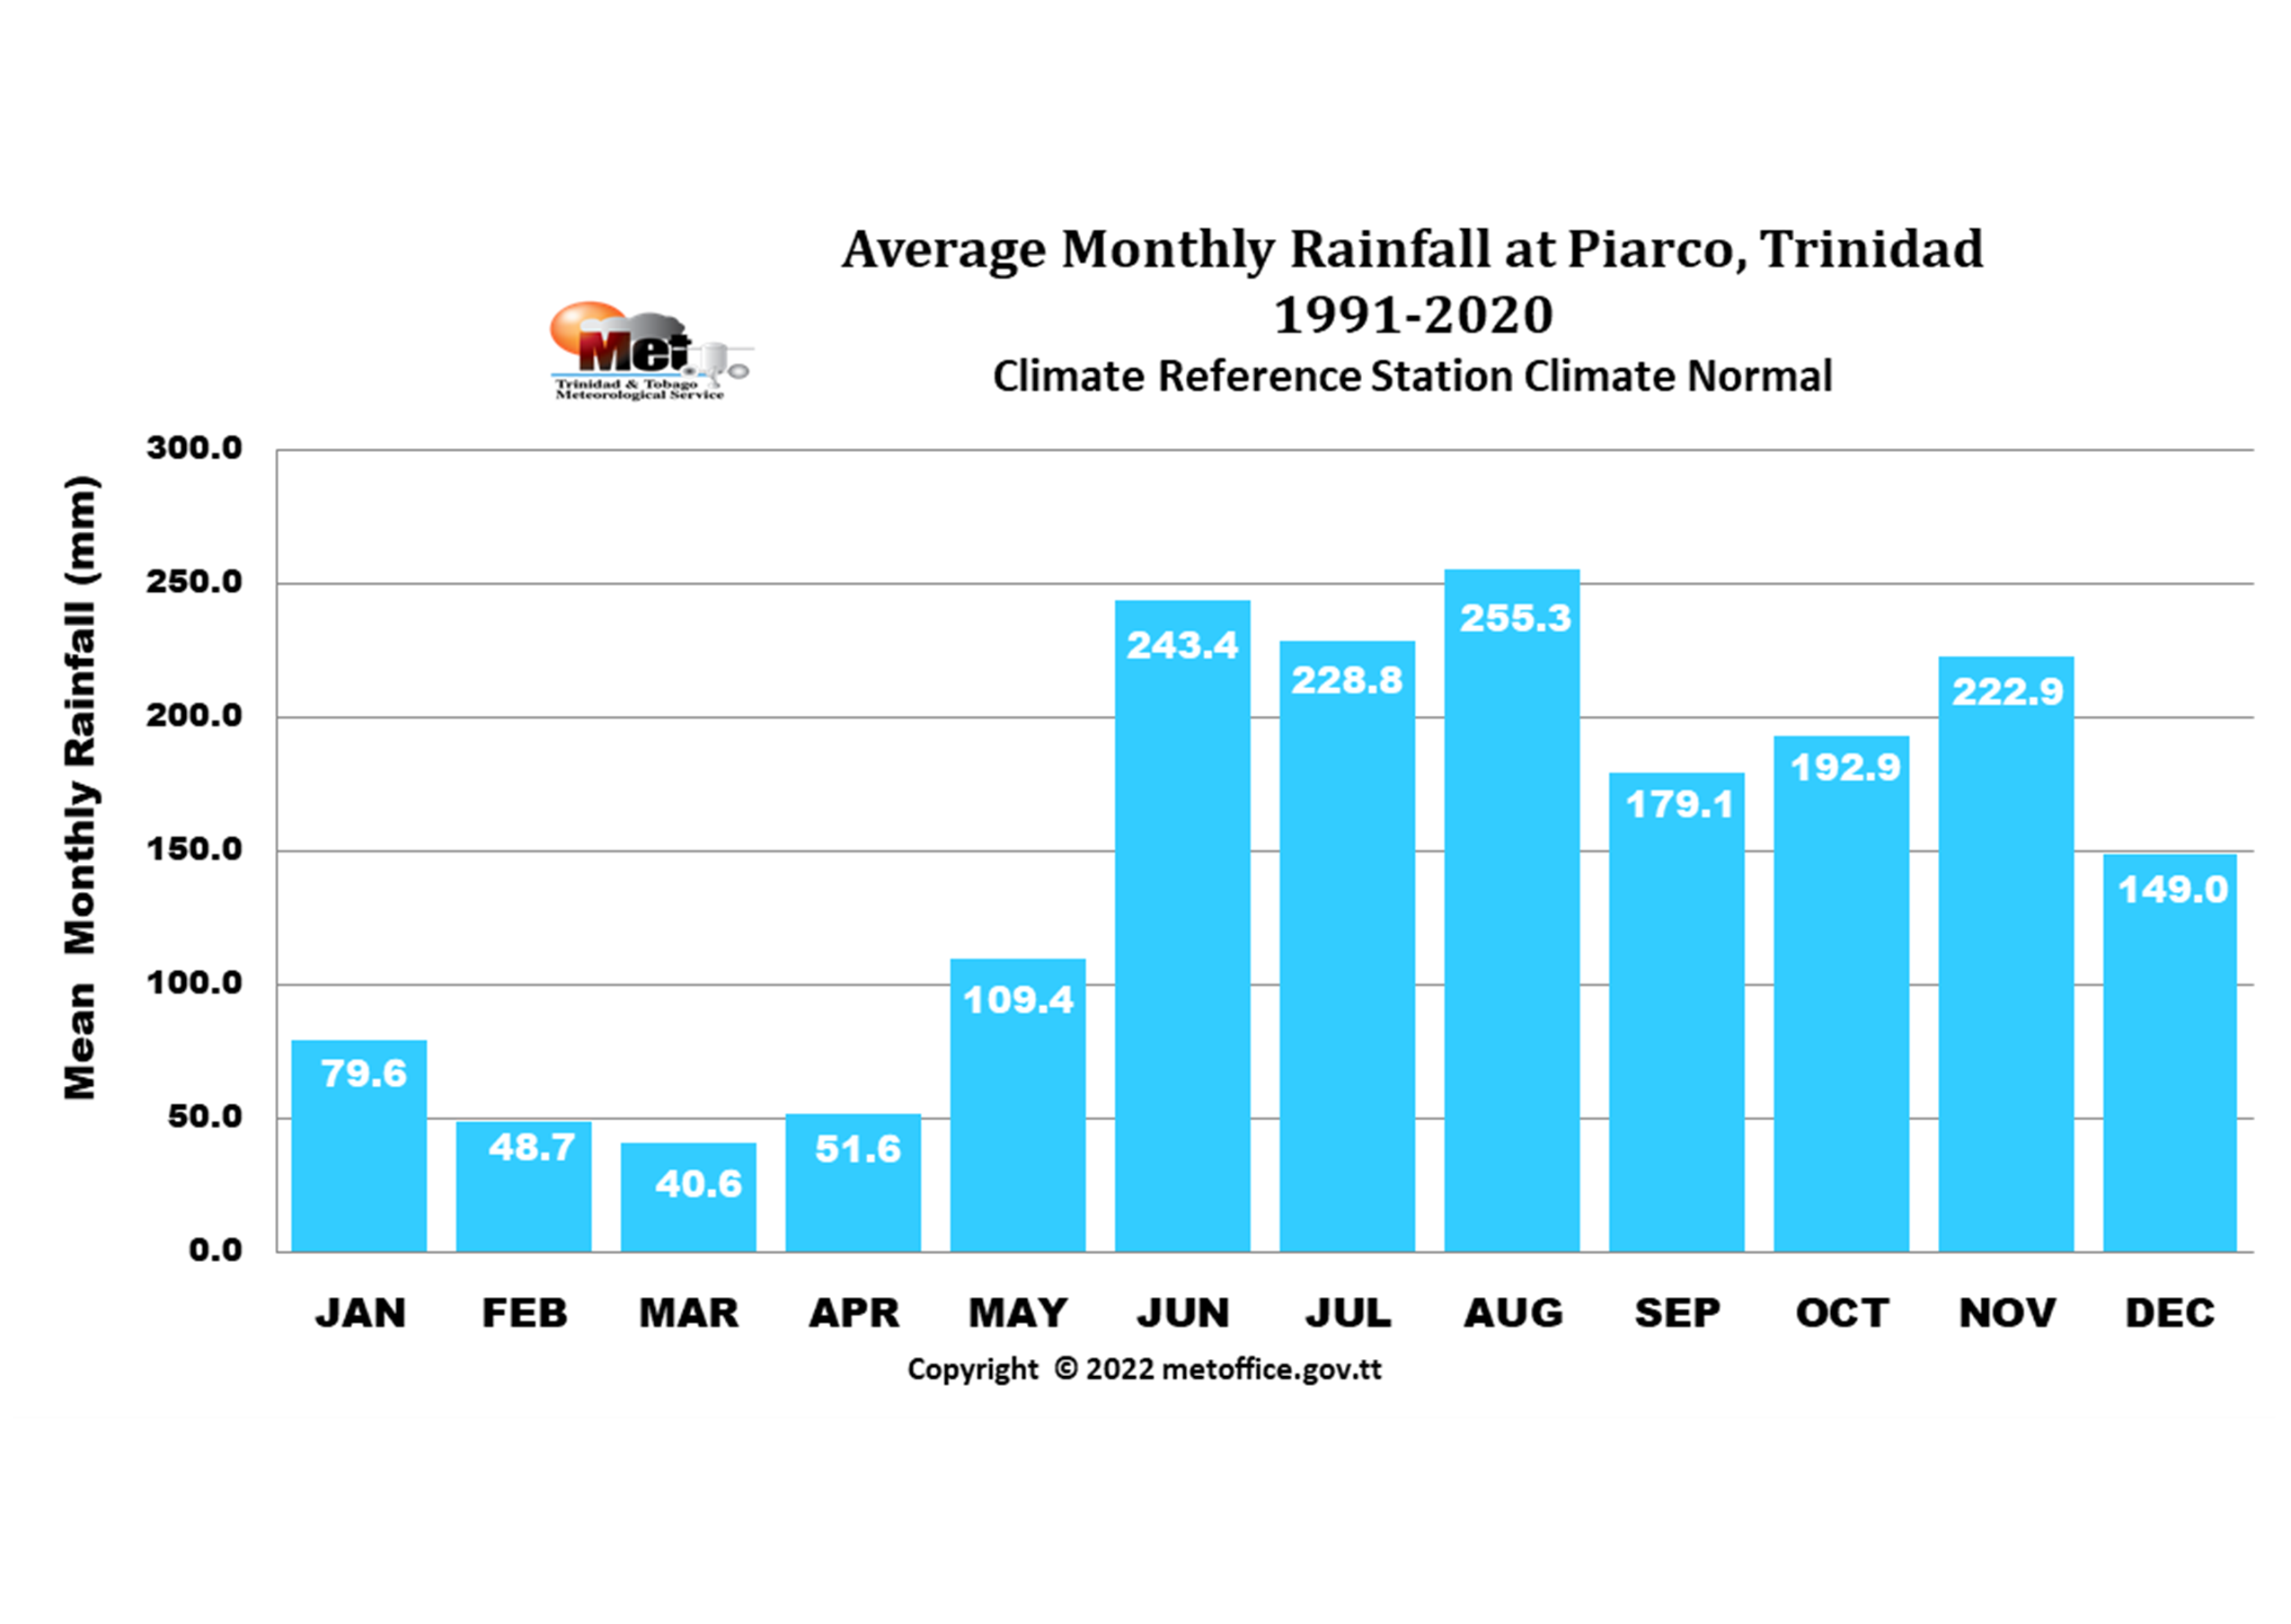
| Long-Term Average Monthly Rainfall Totals (mm) |
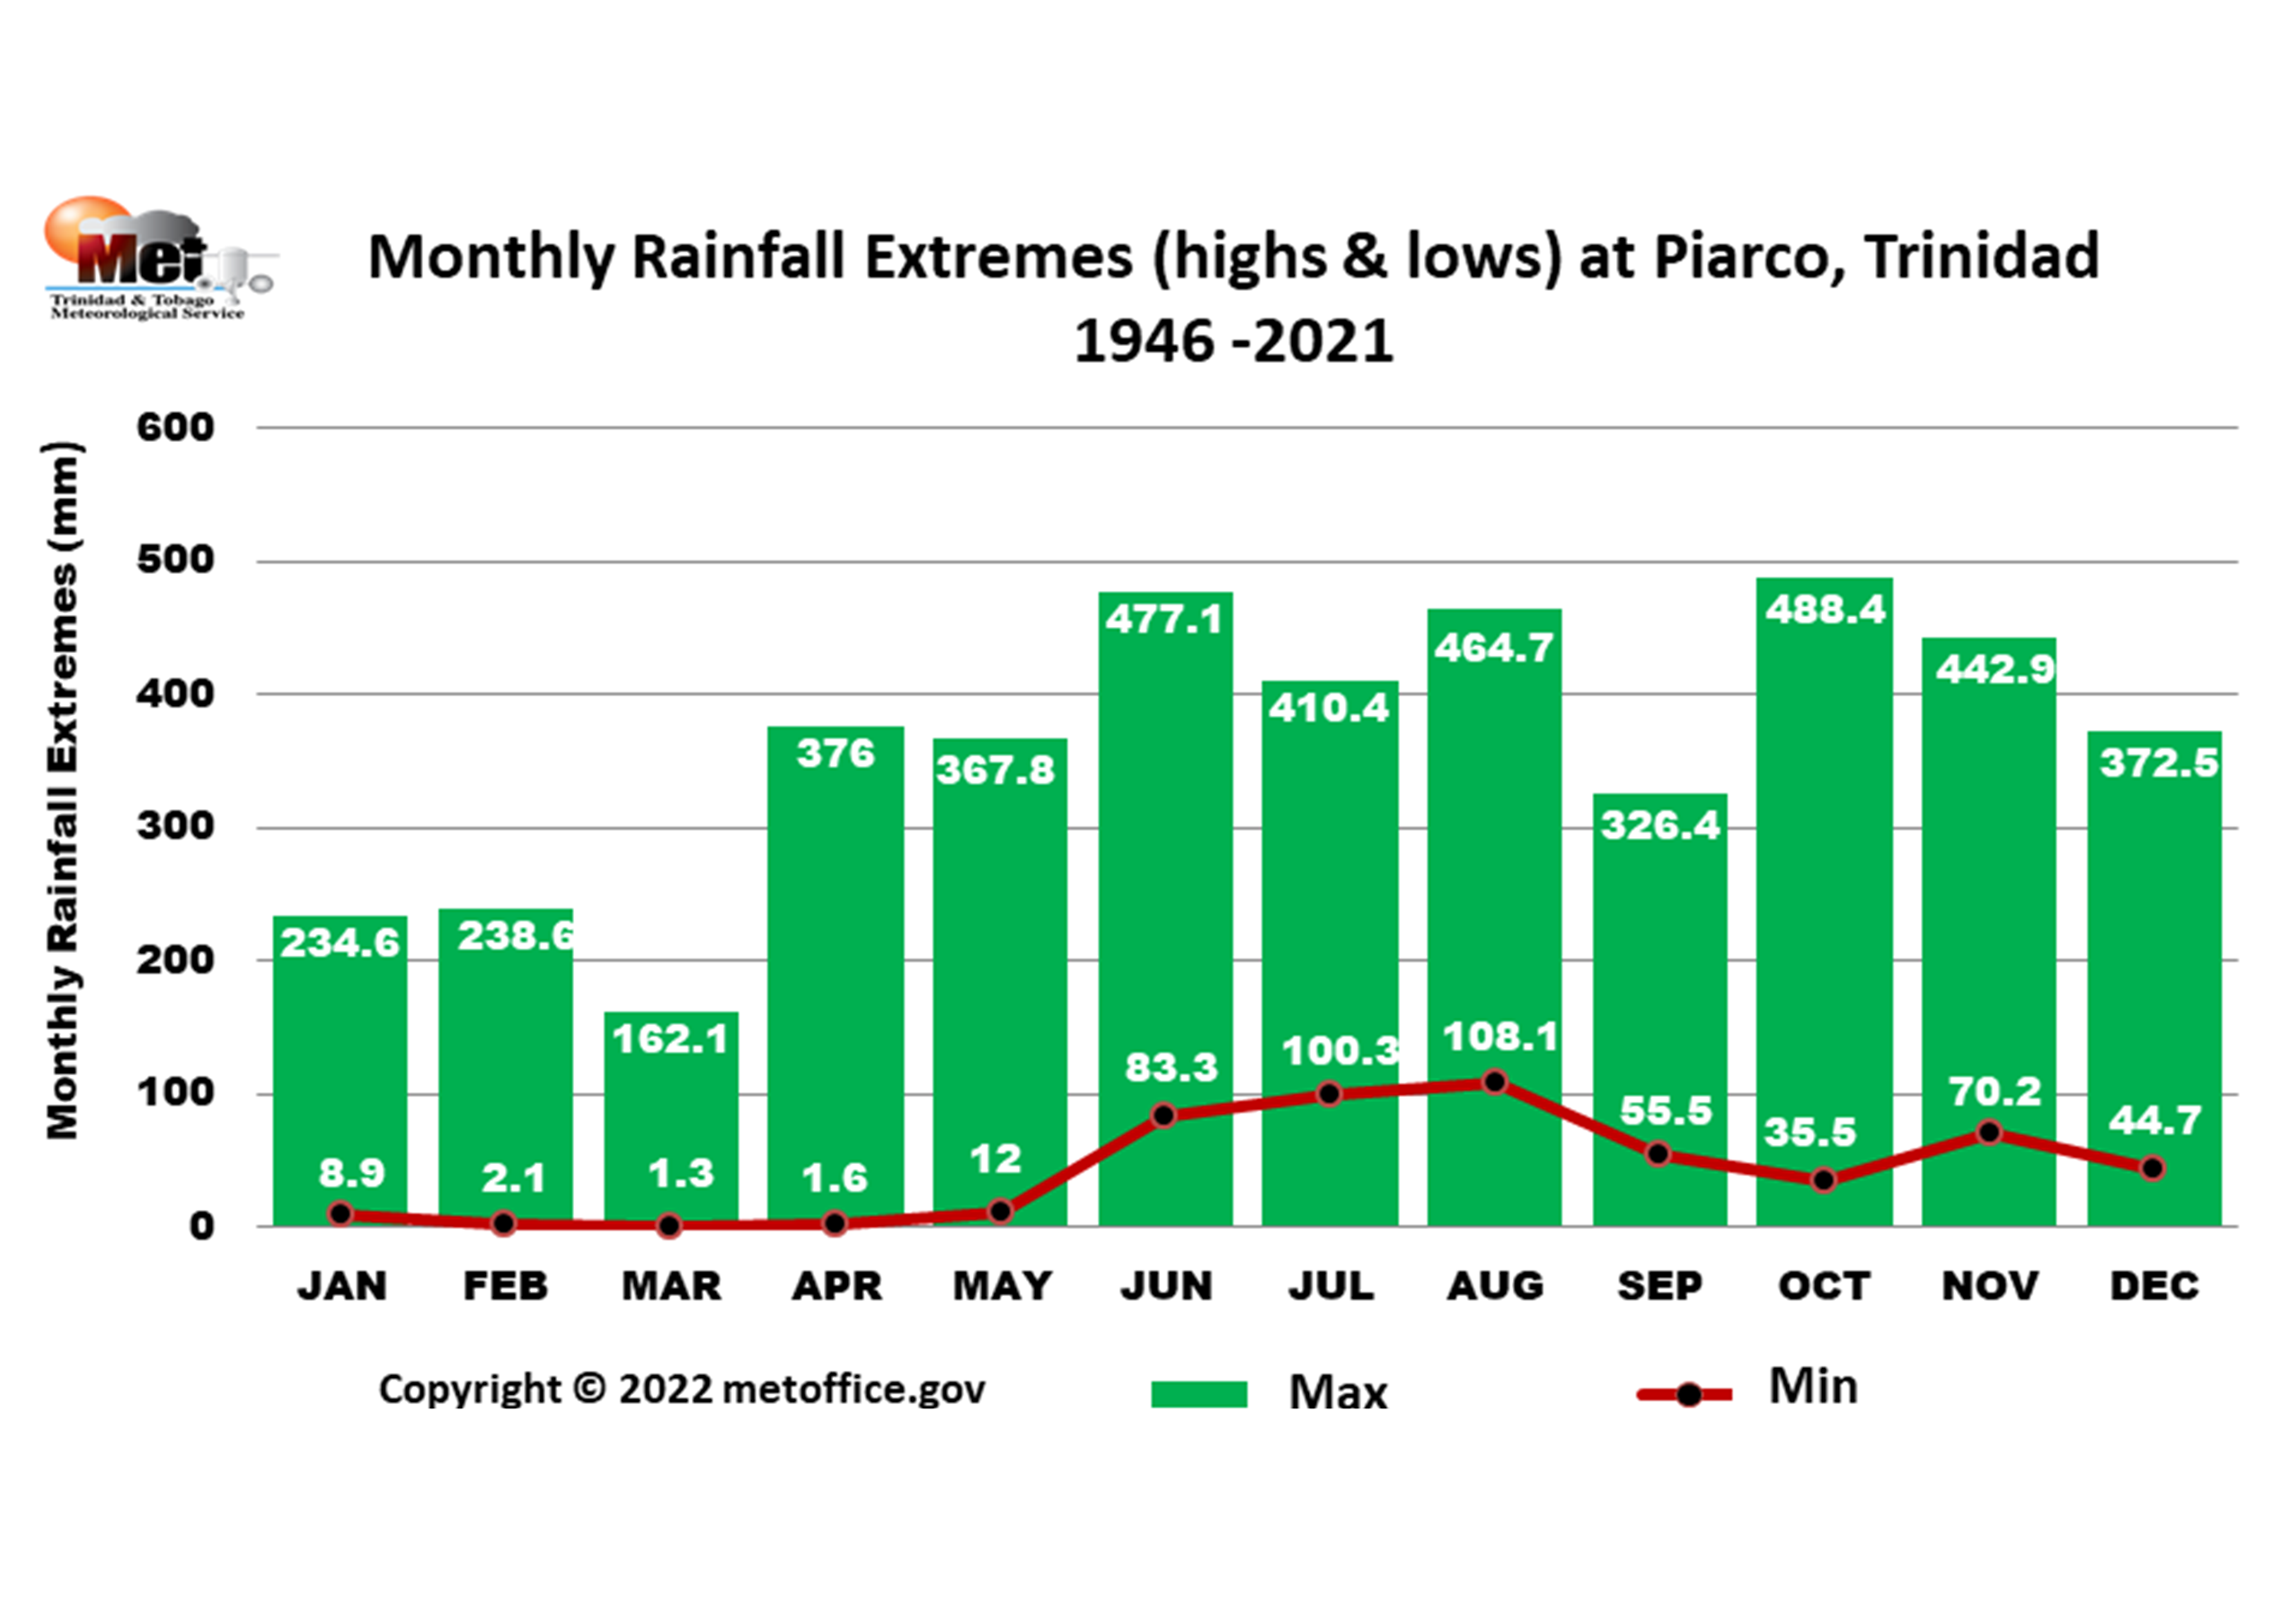
Monthly Extreme Rainfall Records at Piarco (mm) |
 |
 |
| At Piarco for the climate reference period 1991-2020. August is the wettest month, with an average monthly rainfall total of 255.3 mm, followed by June and July. The month of September is usually the driest month of the wet season with 179.1 mm. Sometimes there is a short dry spell in September across the entire country, which may possibly last for one to two weeks or even longer as seen in some years. The driest month of the year is March, with an average of 40.6 mm of rainfall. |
The month of October (1988) with 488.4 mm produced the highest monthly rainfall total on record at Piarco between 1946 and 2021. The month of March (1966) with 1.3 mm has produced the lowest monthly rainfall totals |
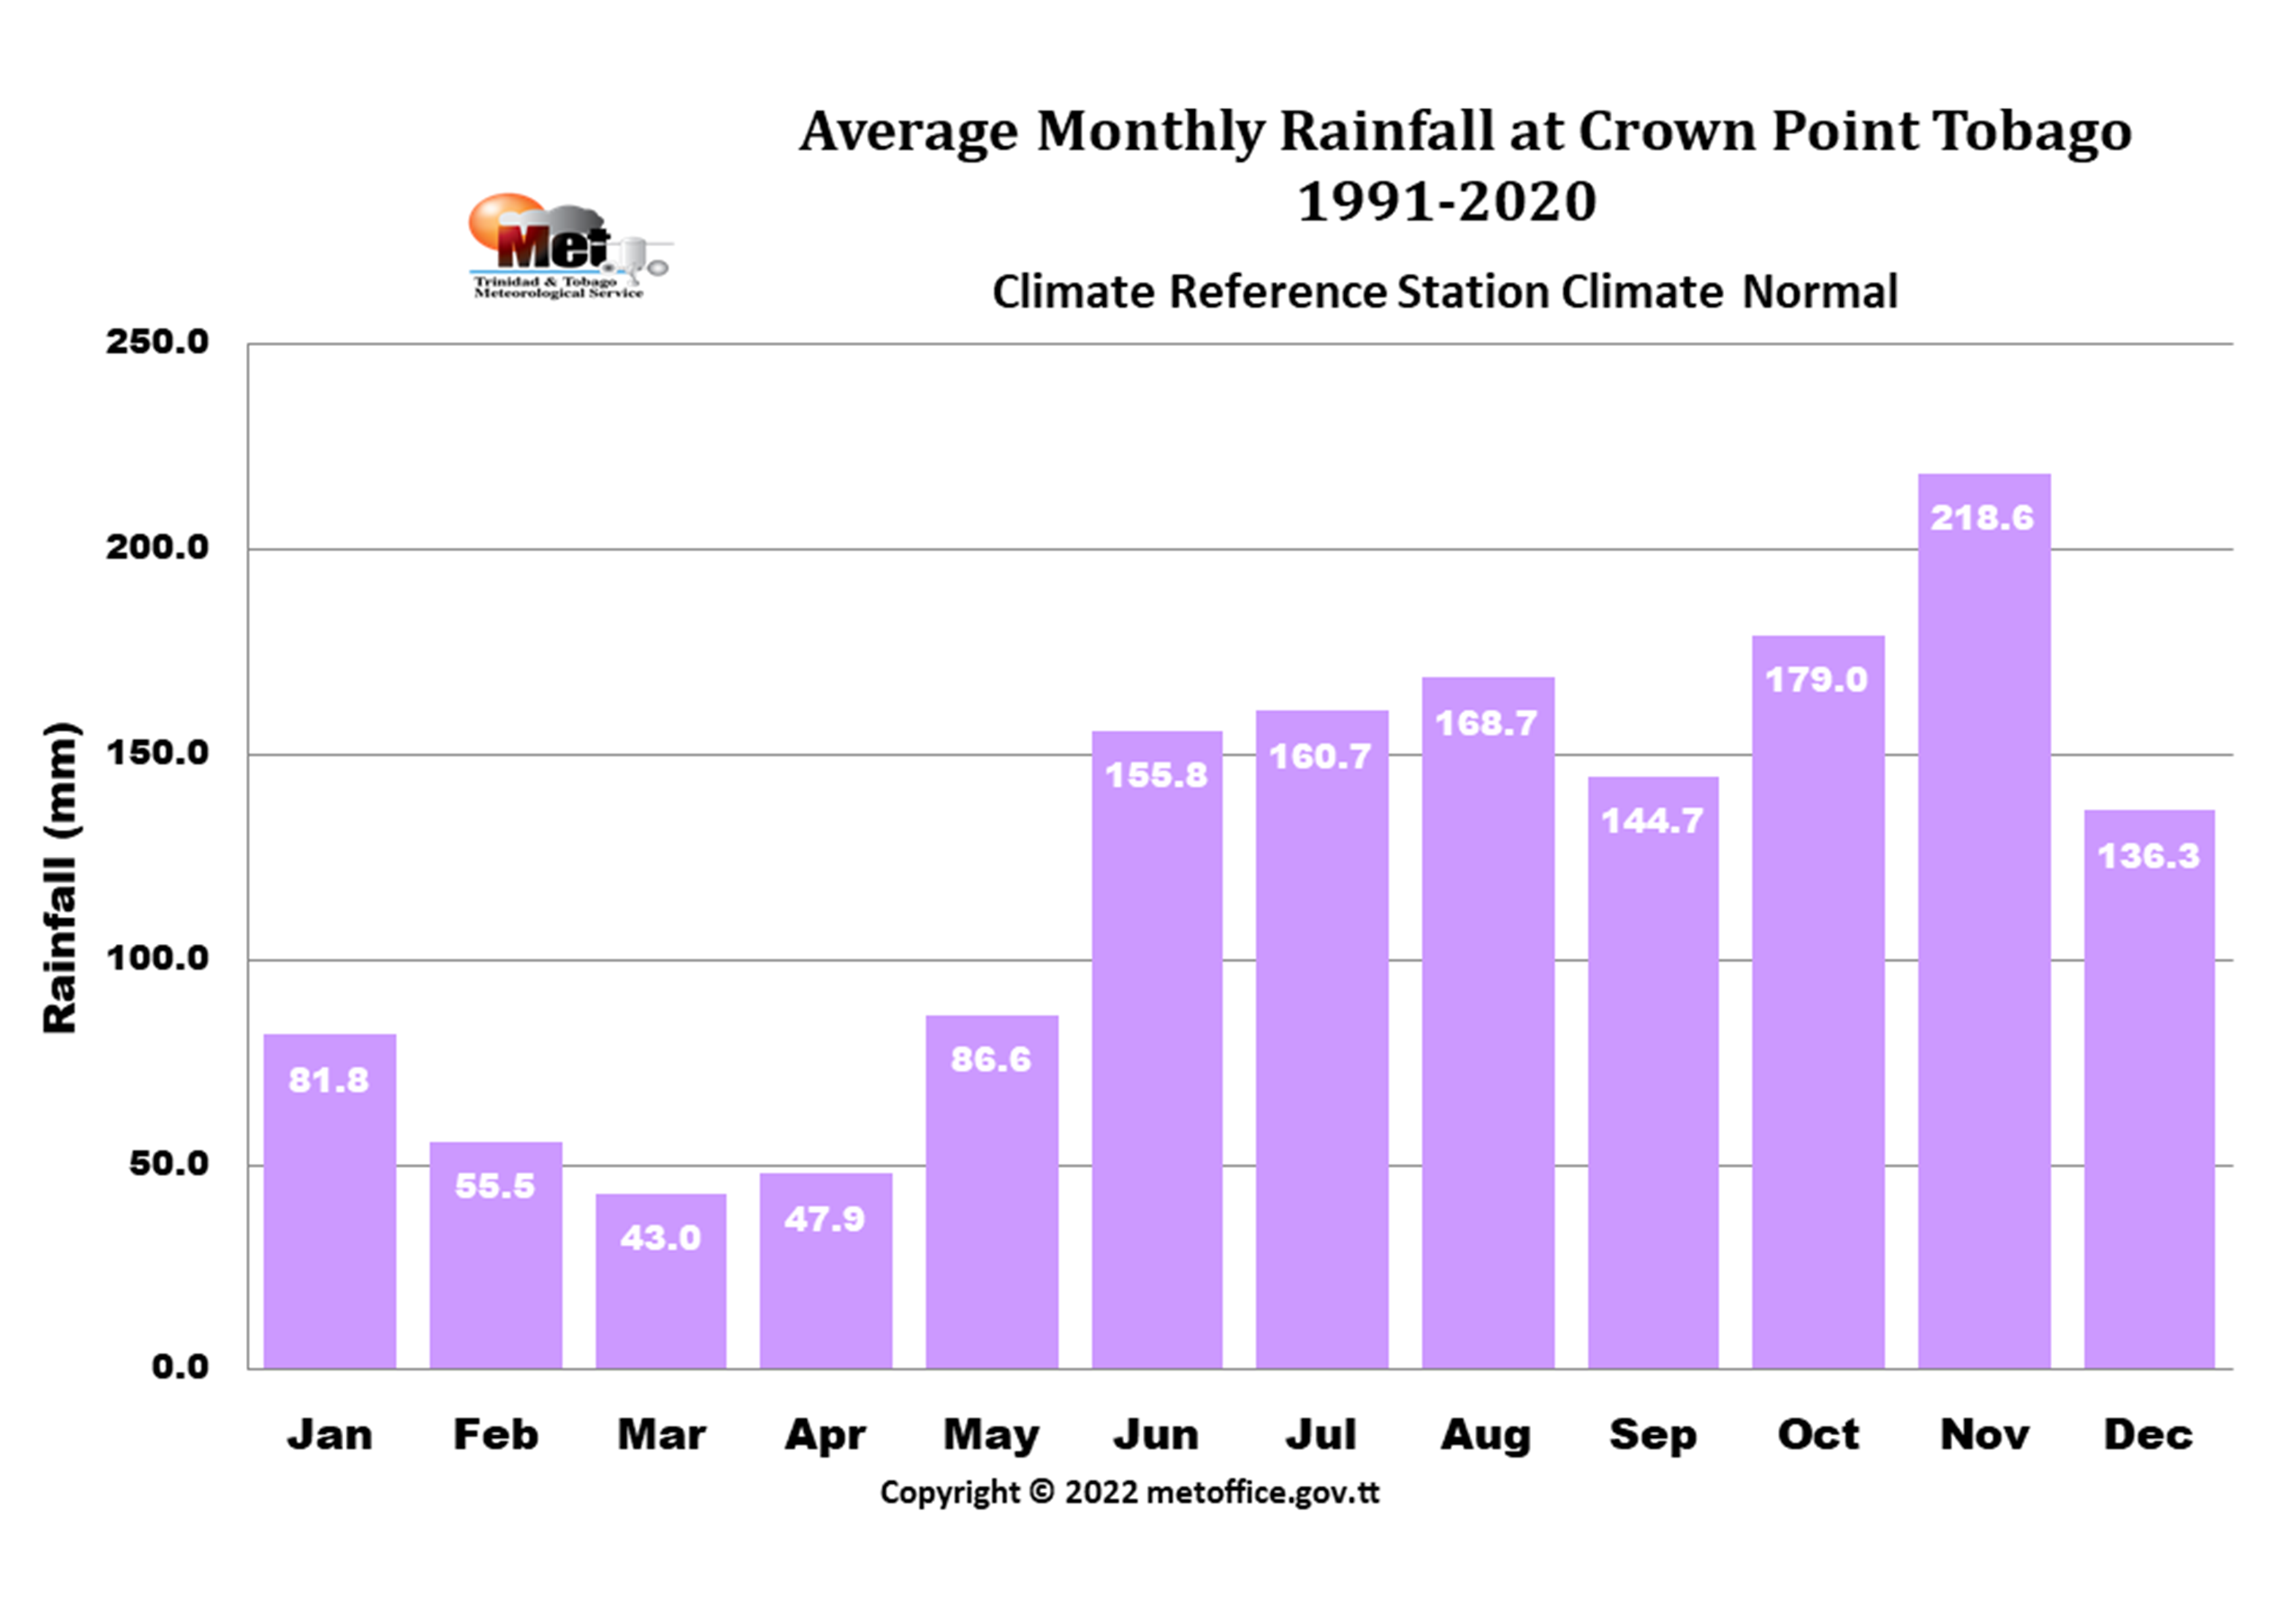
| Long-Term Average Monthly Rainfall Totals (mm) |
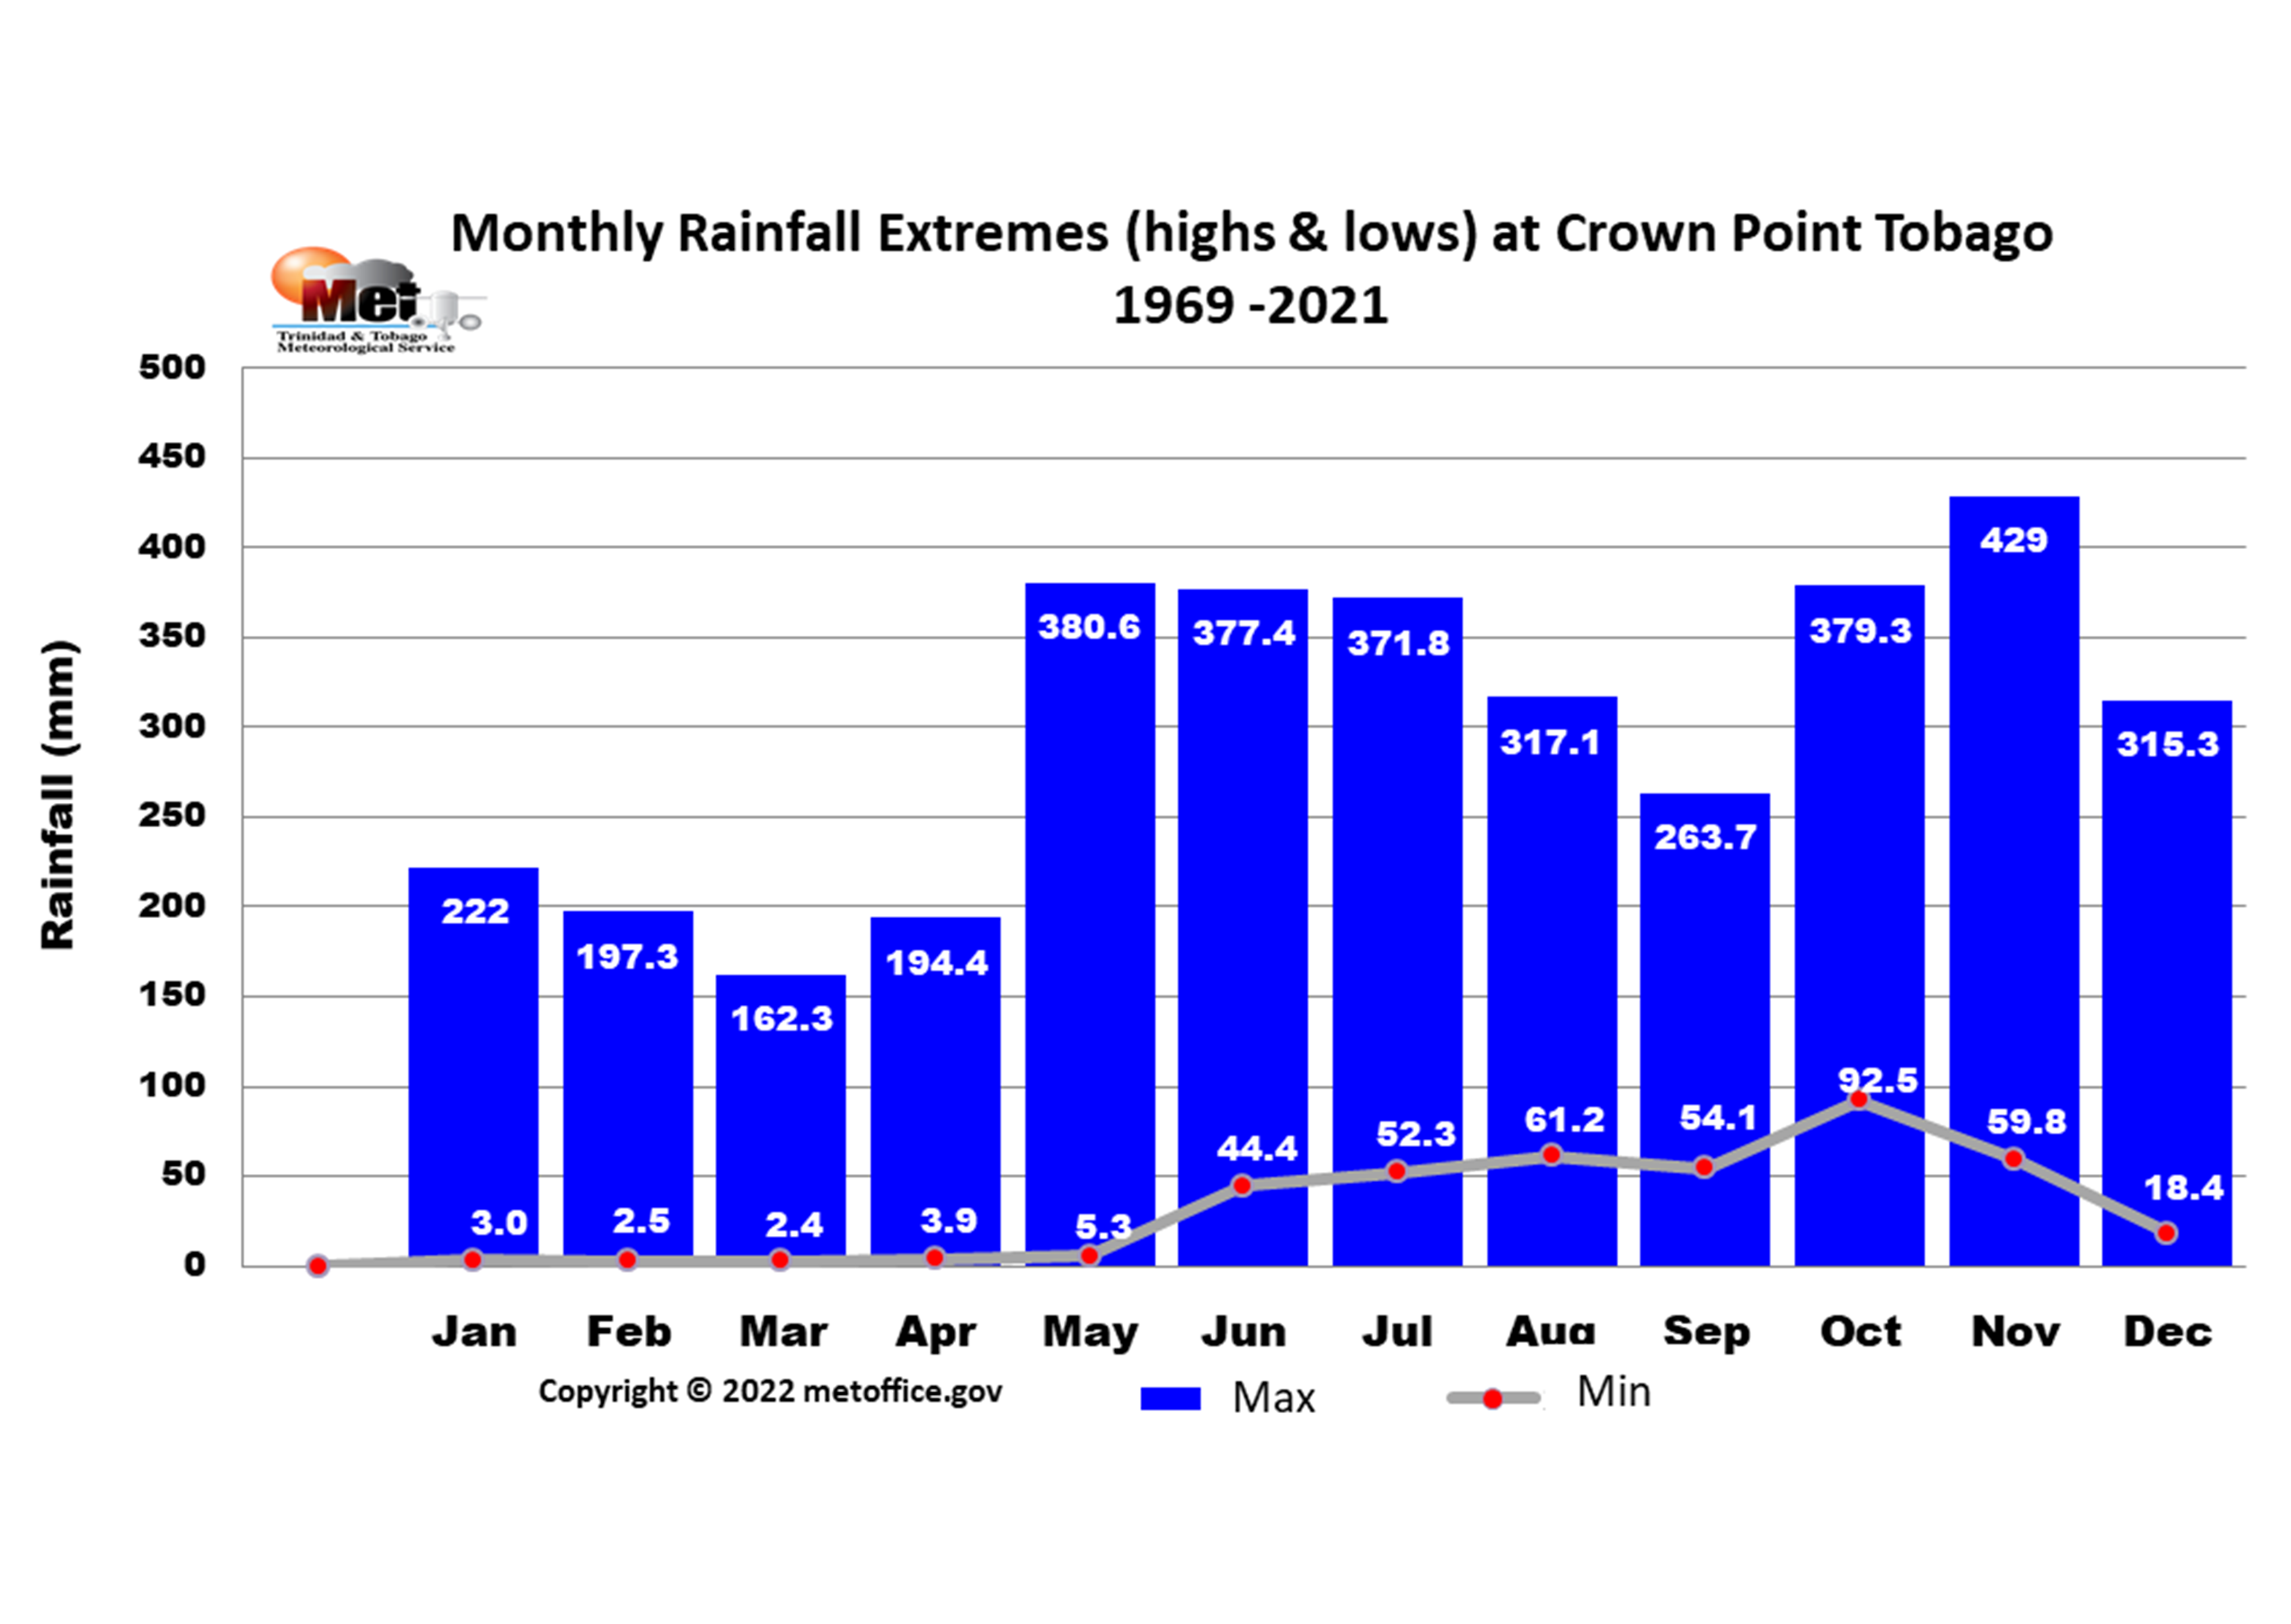
Monthly Extreme Rainfall Records at Crown Point (mm) |
 |
 |
| At Crown Point for the climate reference period 1991-2020 November is the wettest month, with an average monthly rainfall total of 218.6 mm, followed by October with 179.0mm. The month of December is usually the driest month of the wet season, with an average rainfall total of 136.3 mm. March is usually the driest month of the year, with an average of 43.0 mm. |
The month of November (2004) with 429.0 mm produced the highest monthly rainfall total on record at Crown Point between 1971 and 2021. Whereas, the month of March (1992) with 2.4 mm produced the lowest monthly rainfall total on record. |
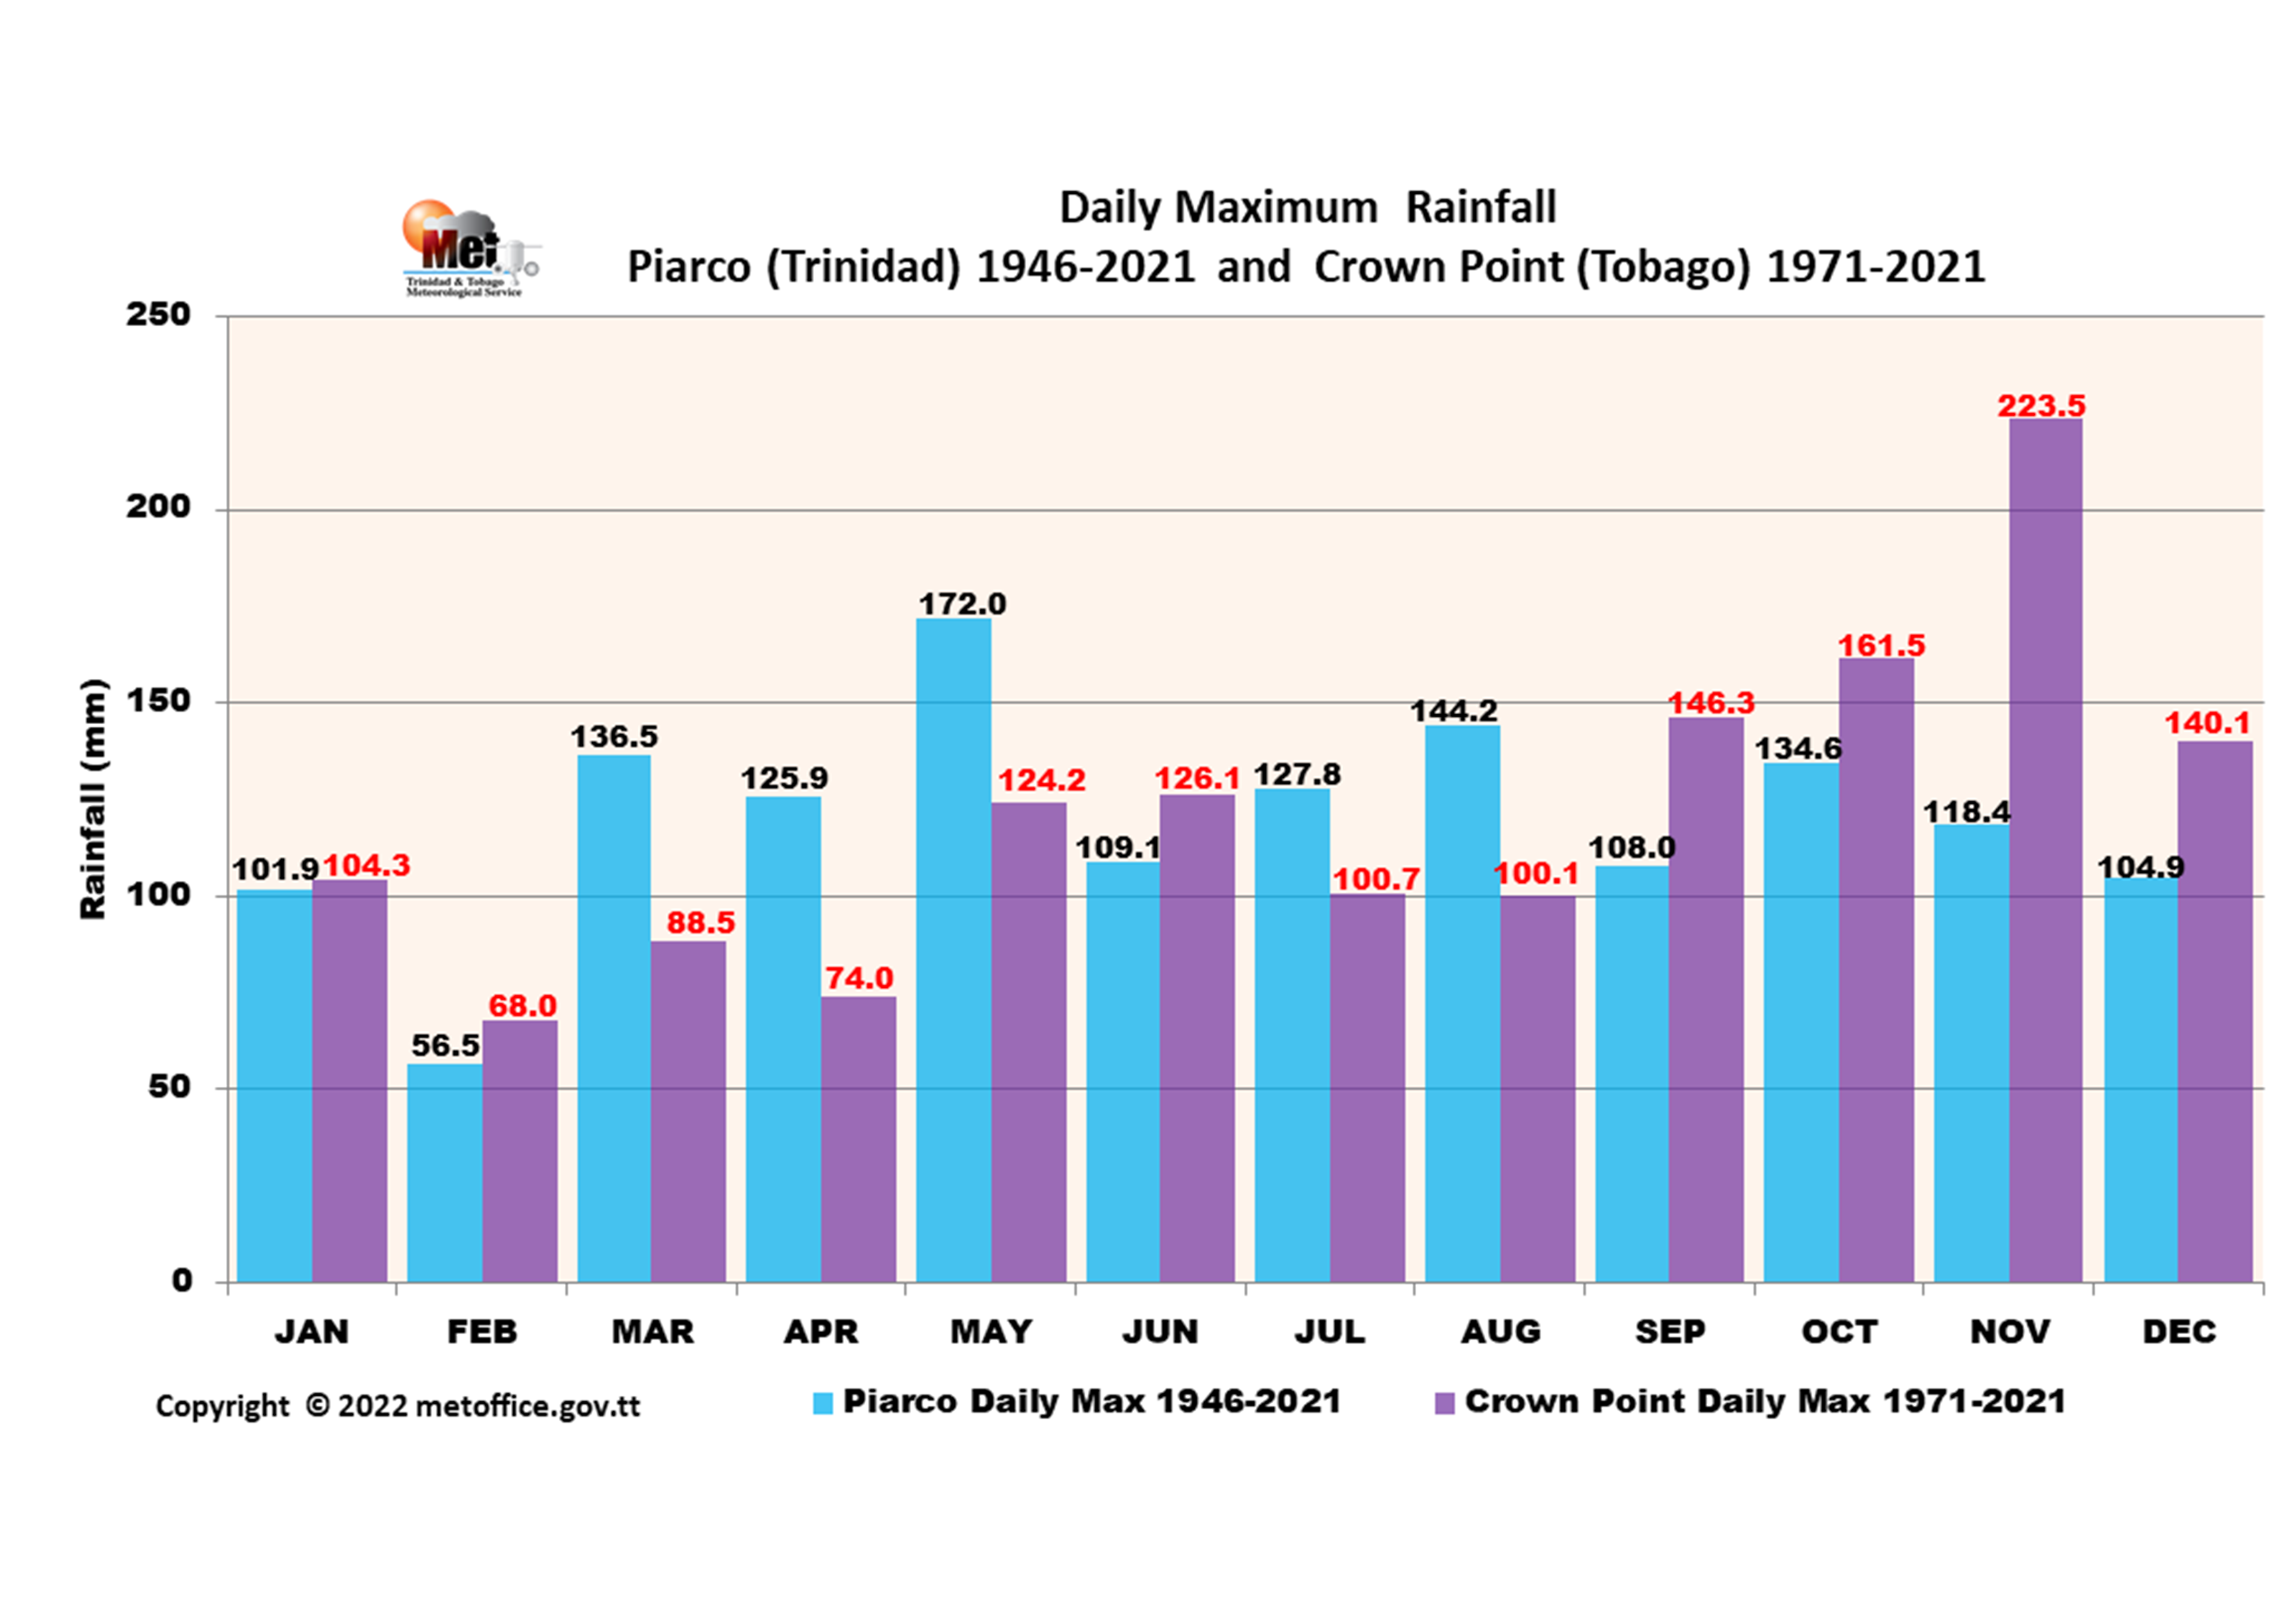
| Record of Highest Daily Maximum Rainfall (mm) |
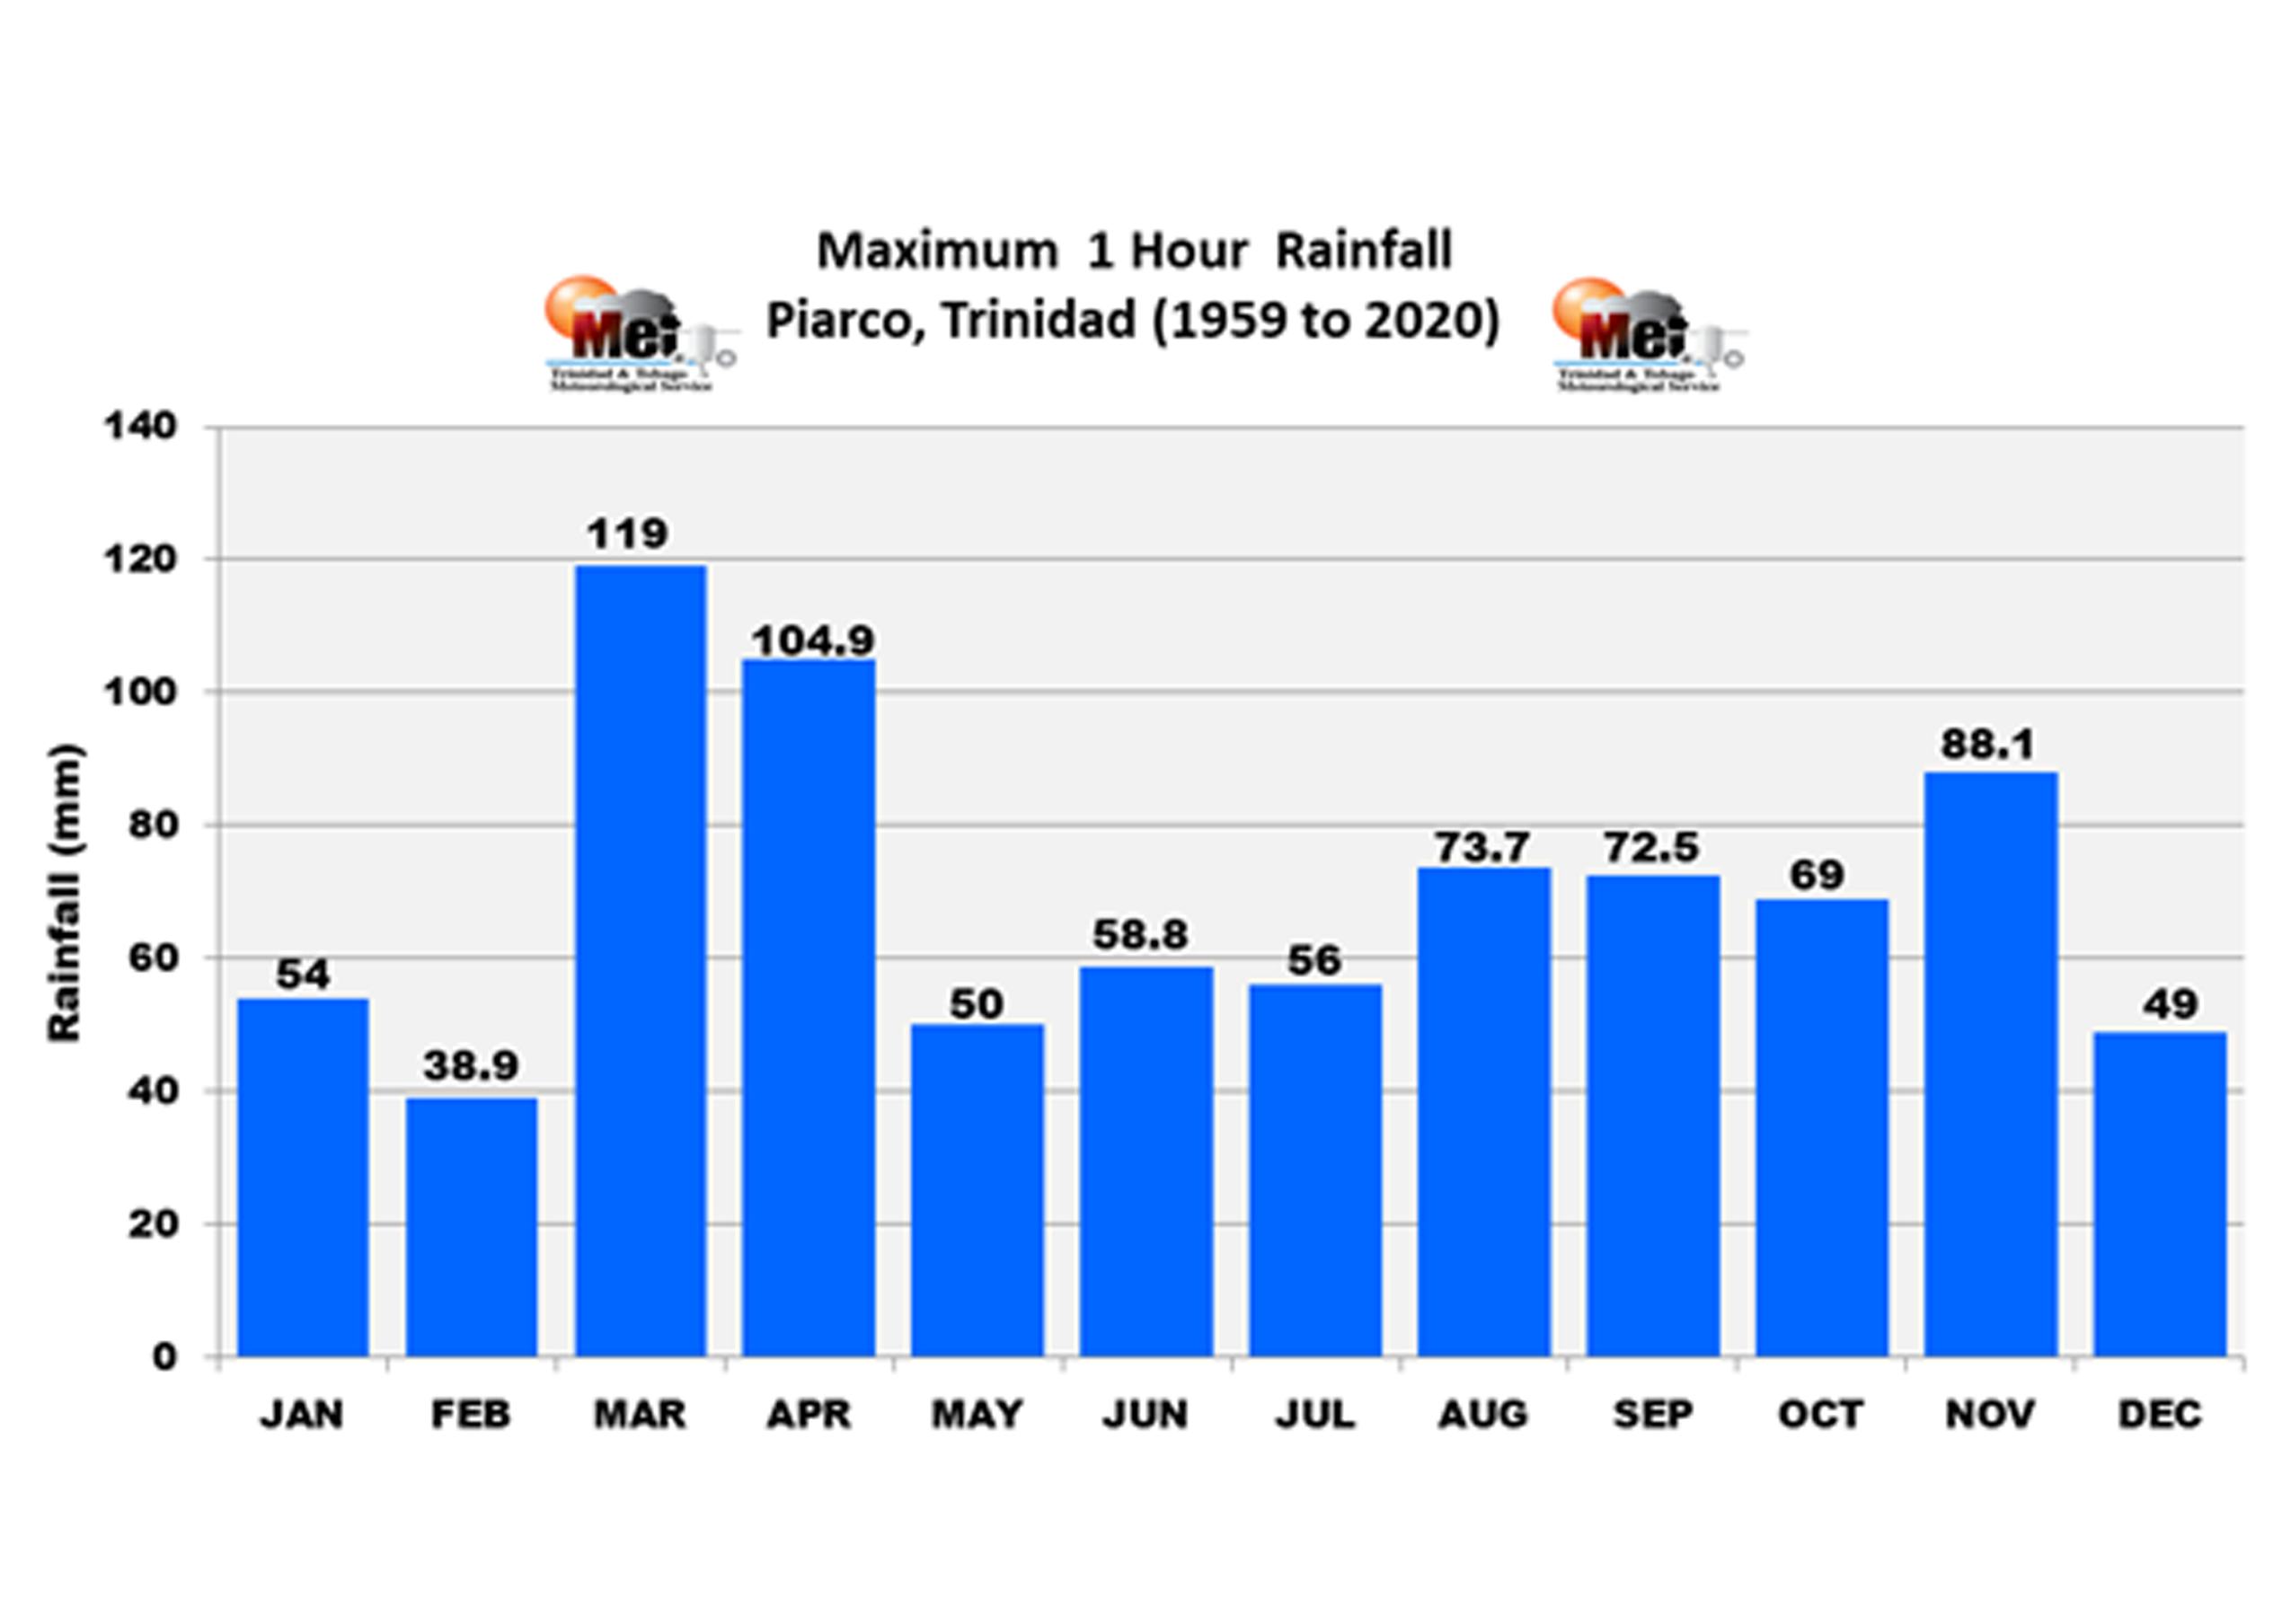
Record of Maximum Rainfall (mm) in 1 Hour Recorded at Piarco 1959 to 2020 |
 |
 |
| Maximum 24-hour rainfall at the monthly scale for Piarco and Crown Point for the periods 1946-2021 and 1971-2021 respectively. The highest 24-hour rainfall measured at Piarco is 172.0mm, which occurred on May 25th 2010. March which is usually the driest month, produced the 3rd highest 24-hour rainfall at Piarco. This occurred on March 04, 2018. At Crown Point, the highest 24-hour rainfall measured is 223.5mm, which occurred on November 12th, 2004. |
The most rainfall in one (1) hour recorded at Piarco from 1946 to 2020 on the monthly scale is shown. The month of March, which is usually the driest month of the year has the record, which occurred on March 4th, 2018, followed by April, which occurred on April 22nd, 1973. |
| Record of Maximum and Average Number of Thunderstorm Days Observed at Piarco 1959 to 2020 |
 |
| Monthly maximum numbers of thunderstorm days are shown along with the average number of thunderstorm days. Historically August has the record for the most days with thunderstorms while on average; September tends to get the most number of thunderstorm days in Trinidad and Tobago. |
| Top 10 Ranked Highest and Lowest Annual Rainfall Totals, Lowest Dry Season Totals and Highest Wet Season Rainfall Totals at Piarco |
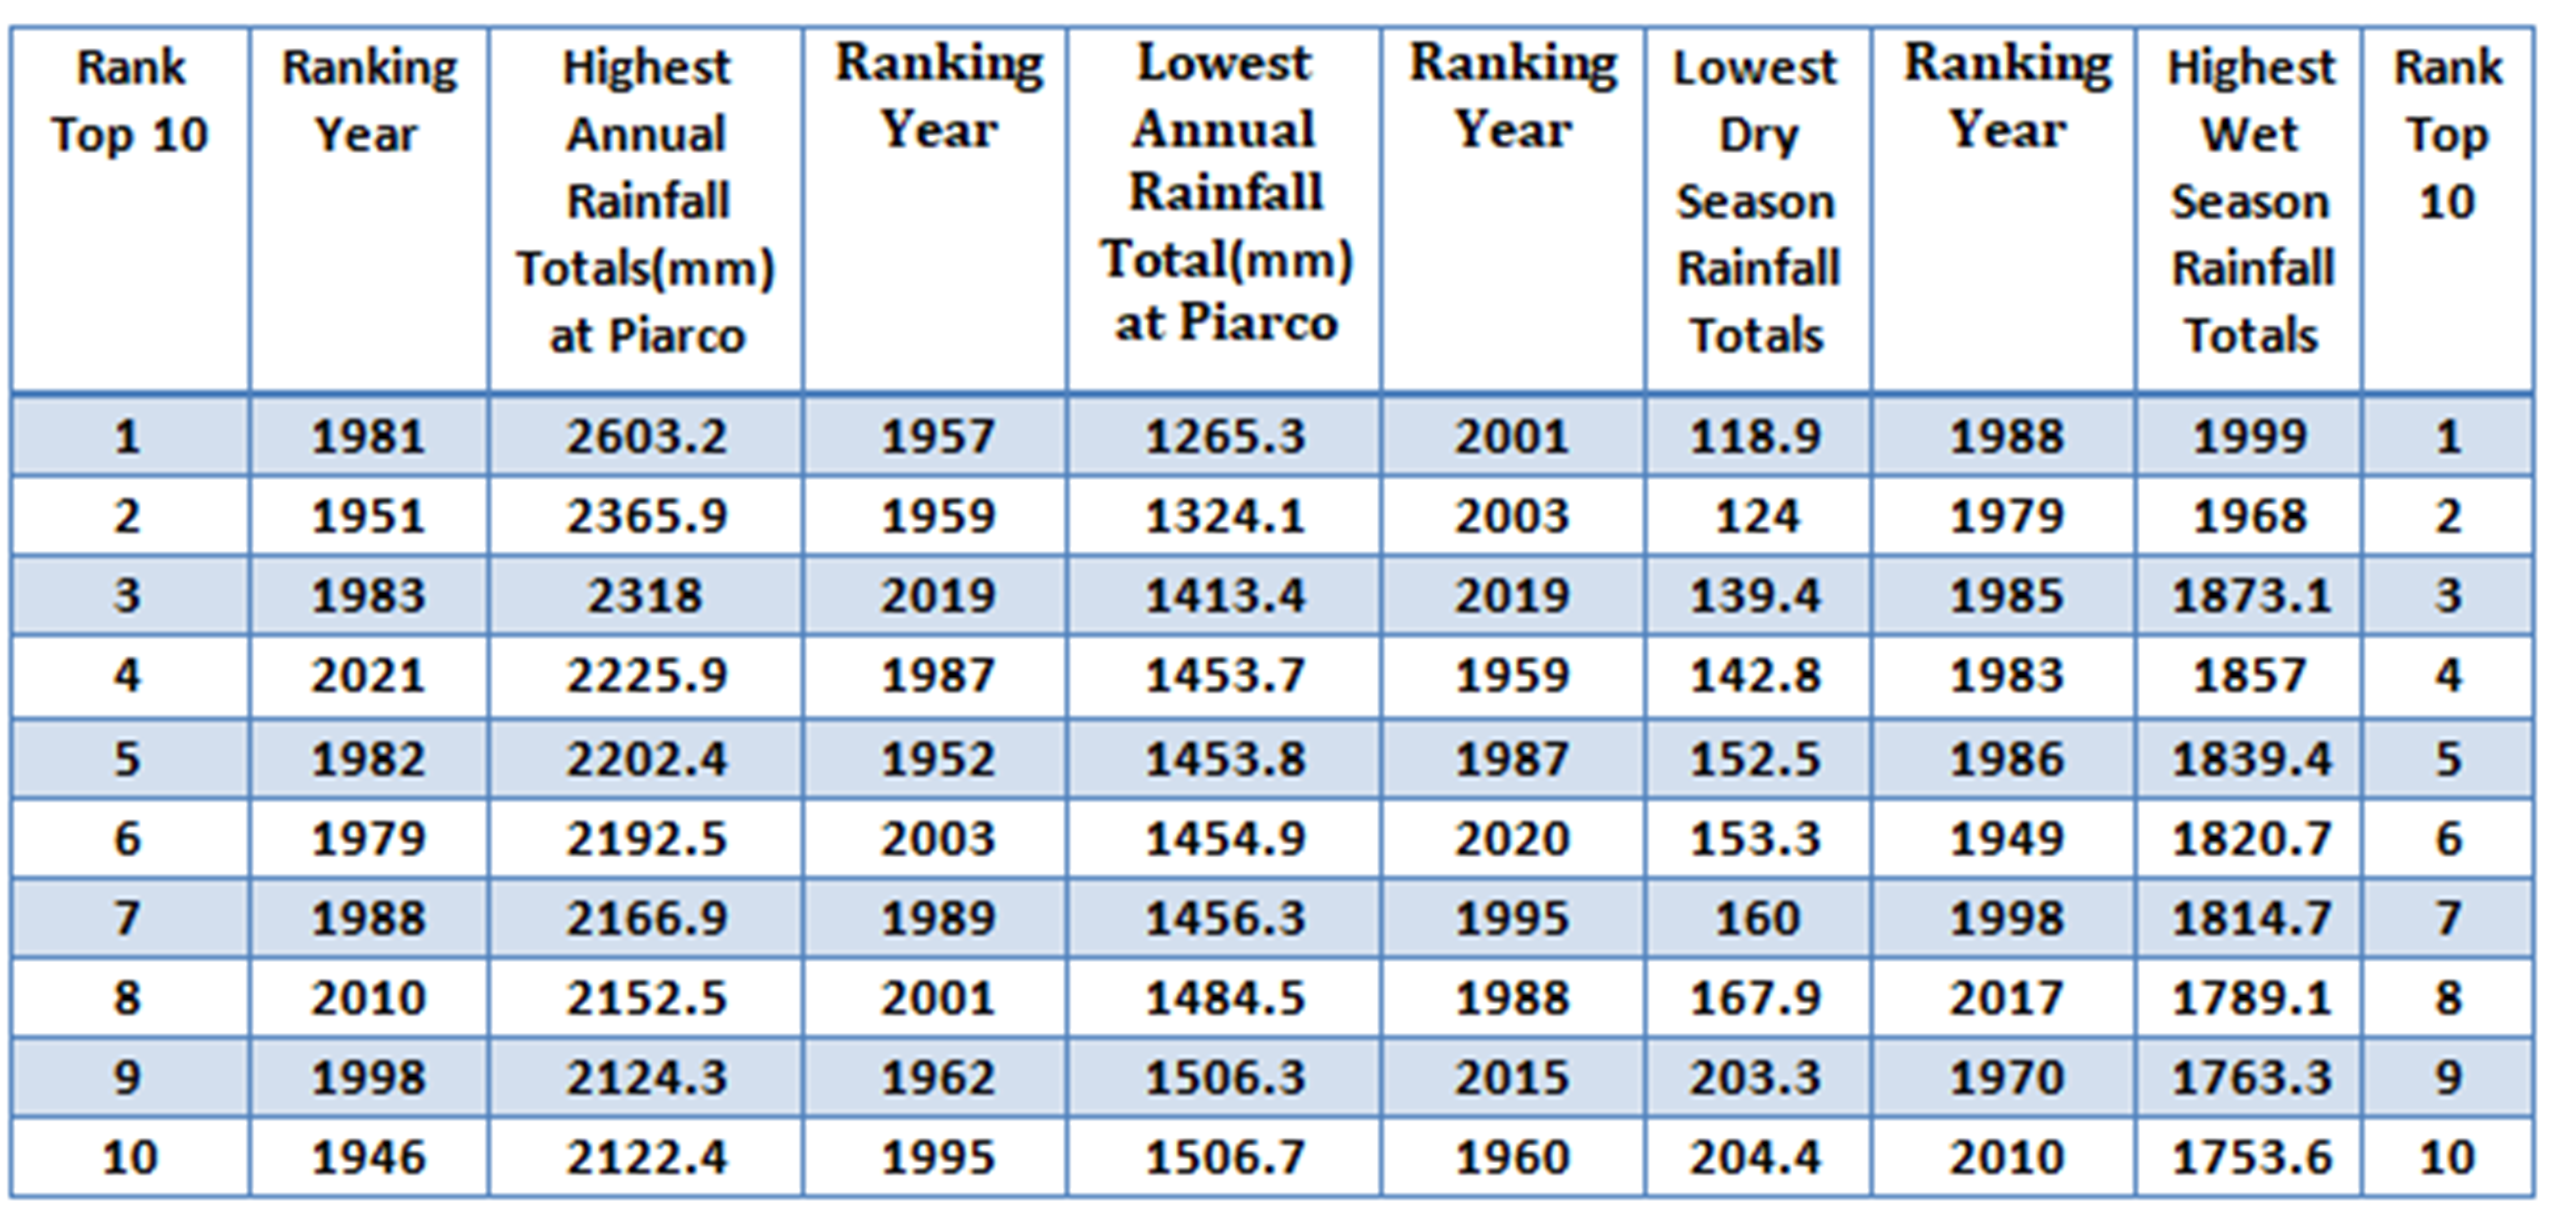 |
| The table on this page displays the top ten highest and lowest annual, wet and dry-seasons rainfall records at Piarco, Trinidad. |
| Top 10 Ranked Highest and Lowest Annual Rainfall Totals, Lowest Dry Season Totals and Highest Wet Season Rainfall Totals at Crown Point |
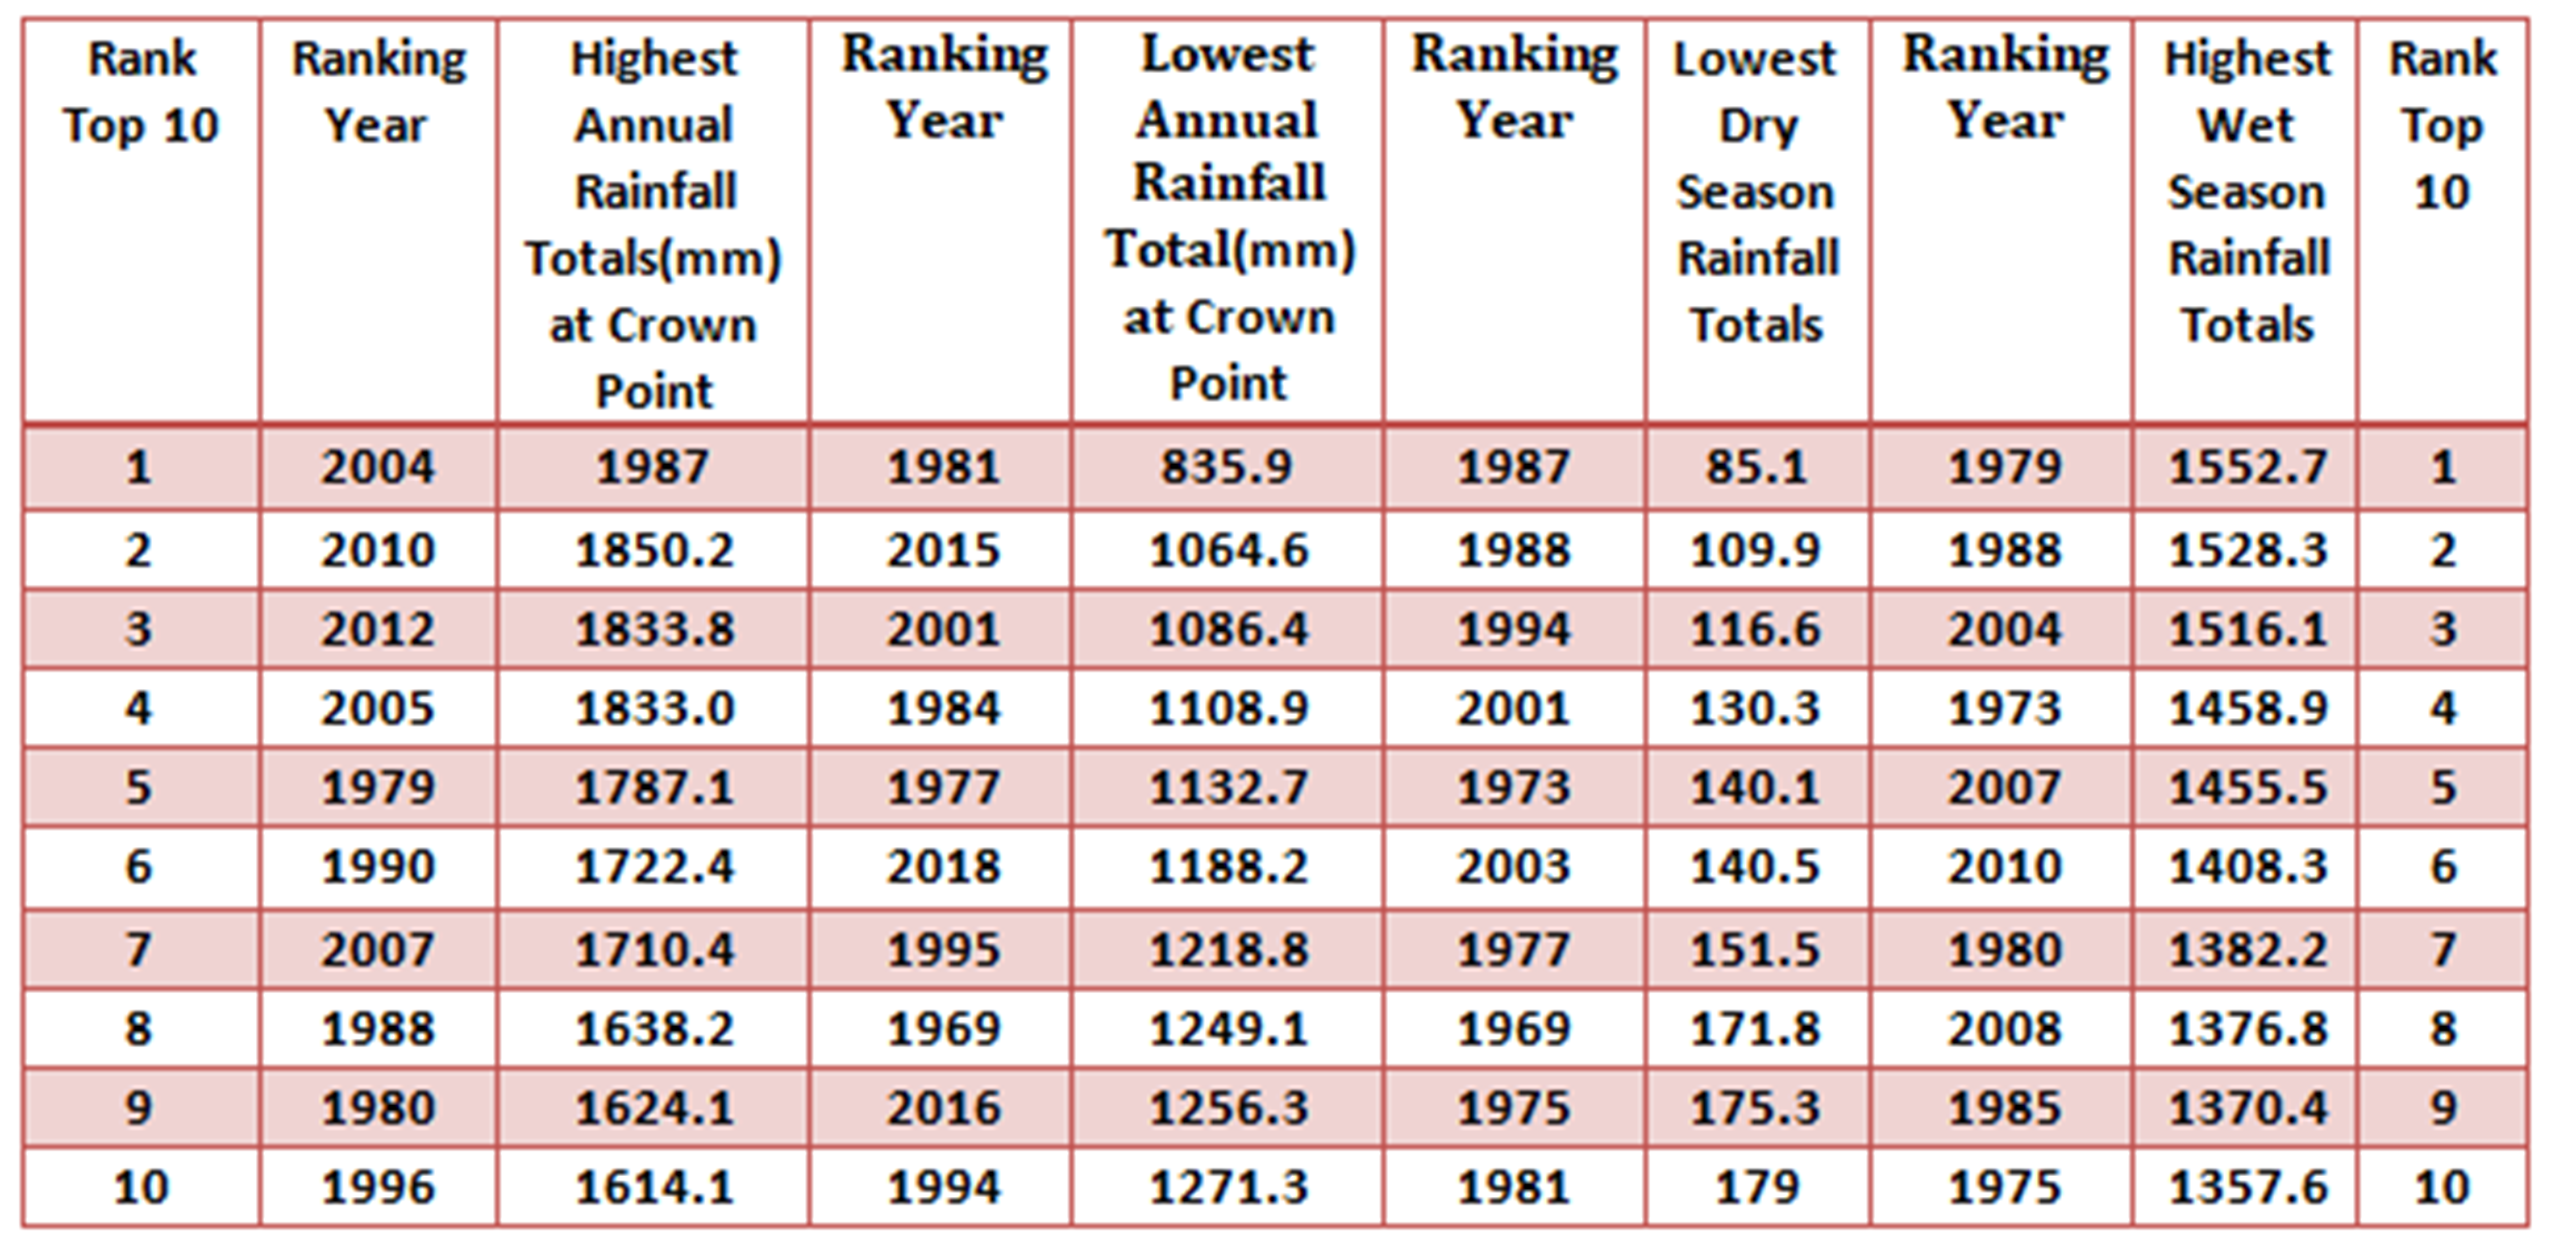 |
| The table on this page displays the top ten highest and lowest annual, wet and dry-seasons rainfall records at Crown Point, Tobago. |
| Hail Reports in Trinidad and Tobago by Month, Since 1980 |
| This hail climatology report was obtained from the Meteorological Services Division (MSD) records. It will assist with understanding when a hail event is most likely to occur and when a rare event occurs. There have been 6 reports of hail occurrences that have been verified by the MSD in Trinidad and Tobago since 1980. The number of hail reports rose steadily over the years, doubling from 1 in the 1980s to 2 in the 1990s and 3 in the 2020s. The last two years had 3 reports, 2 in 2020 and 1 in 2021. N.B. These are events that the Meteorological Services Division has in its records. There may have been other events reported but were not verified or recorded by the MSD. |
| Trinidad and Tobago Record of Hail Events |
| Date |
Location |
Time |
Maximum Day Temperature |
| October 29, 1985 |
Diego Martin Valley |
After Lunch |
32.0ºC |
| September 2, 1990 |
Southern Cunupia (about 3 km south of Piarco) |
After Lunch |
33.7ºC |
| August 12, 1996 |
La Romain, San Fernando, Penal |
After Lunch |
33.5ºC |
| September 08, 2020 |
Carlsen Field, Central, Trinidad |
2:45 pm to 3:15 pm |
33.8ºC |
| October 17, 2020 |
Piarco, North Terminal |
2:00 pm |
33.1ºC |
| September 27, 2021 |
Tacarigua, Trincity, Arouca |
1:20 pm to 1:40 pm |
33.8ºC |
| Monthly Total Days with Hail Reported in Trinidad and Tobago (1980-2021) |
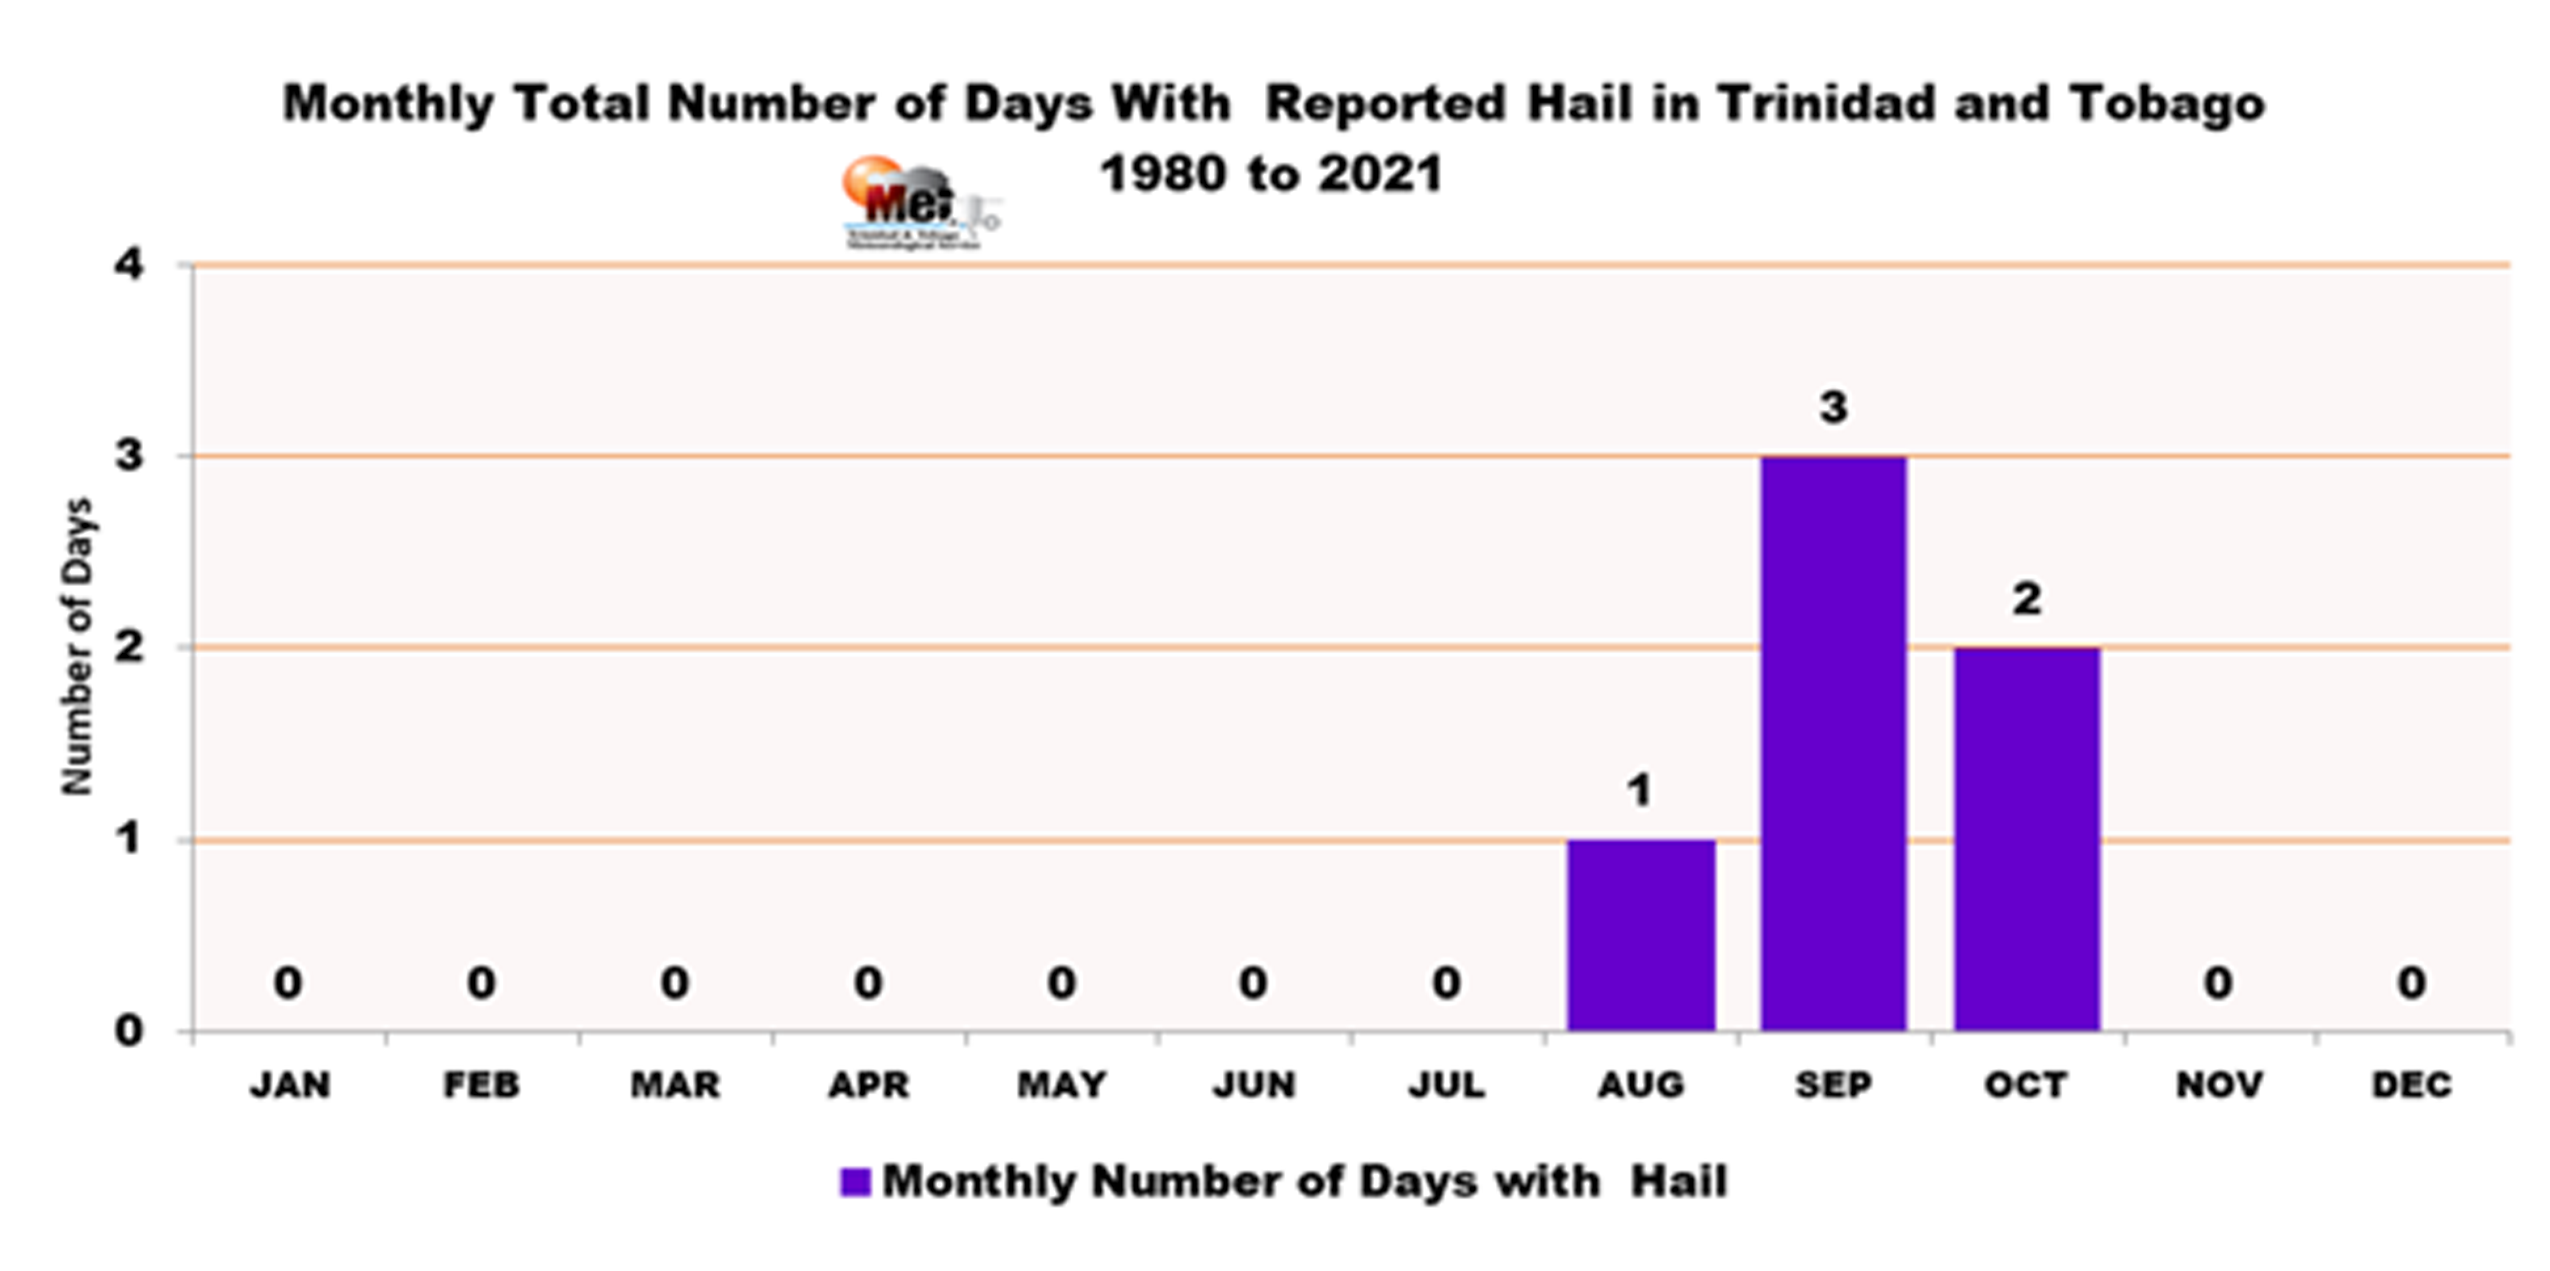 |
| Not surprisingly, 50% of the hail reports in Trinidad and Tobago occurred in September with the remaining 50% occurring over August and October. These three months are both the warmest months of the wet season and the months with the lightest winds on average. September is the warmest month on average in the year and also the record holder for the hottest day on record. |
 |
 |
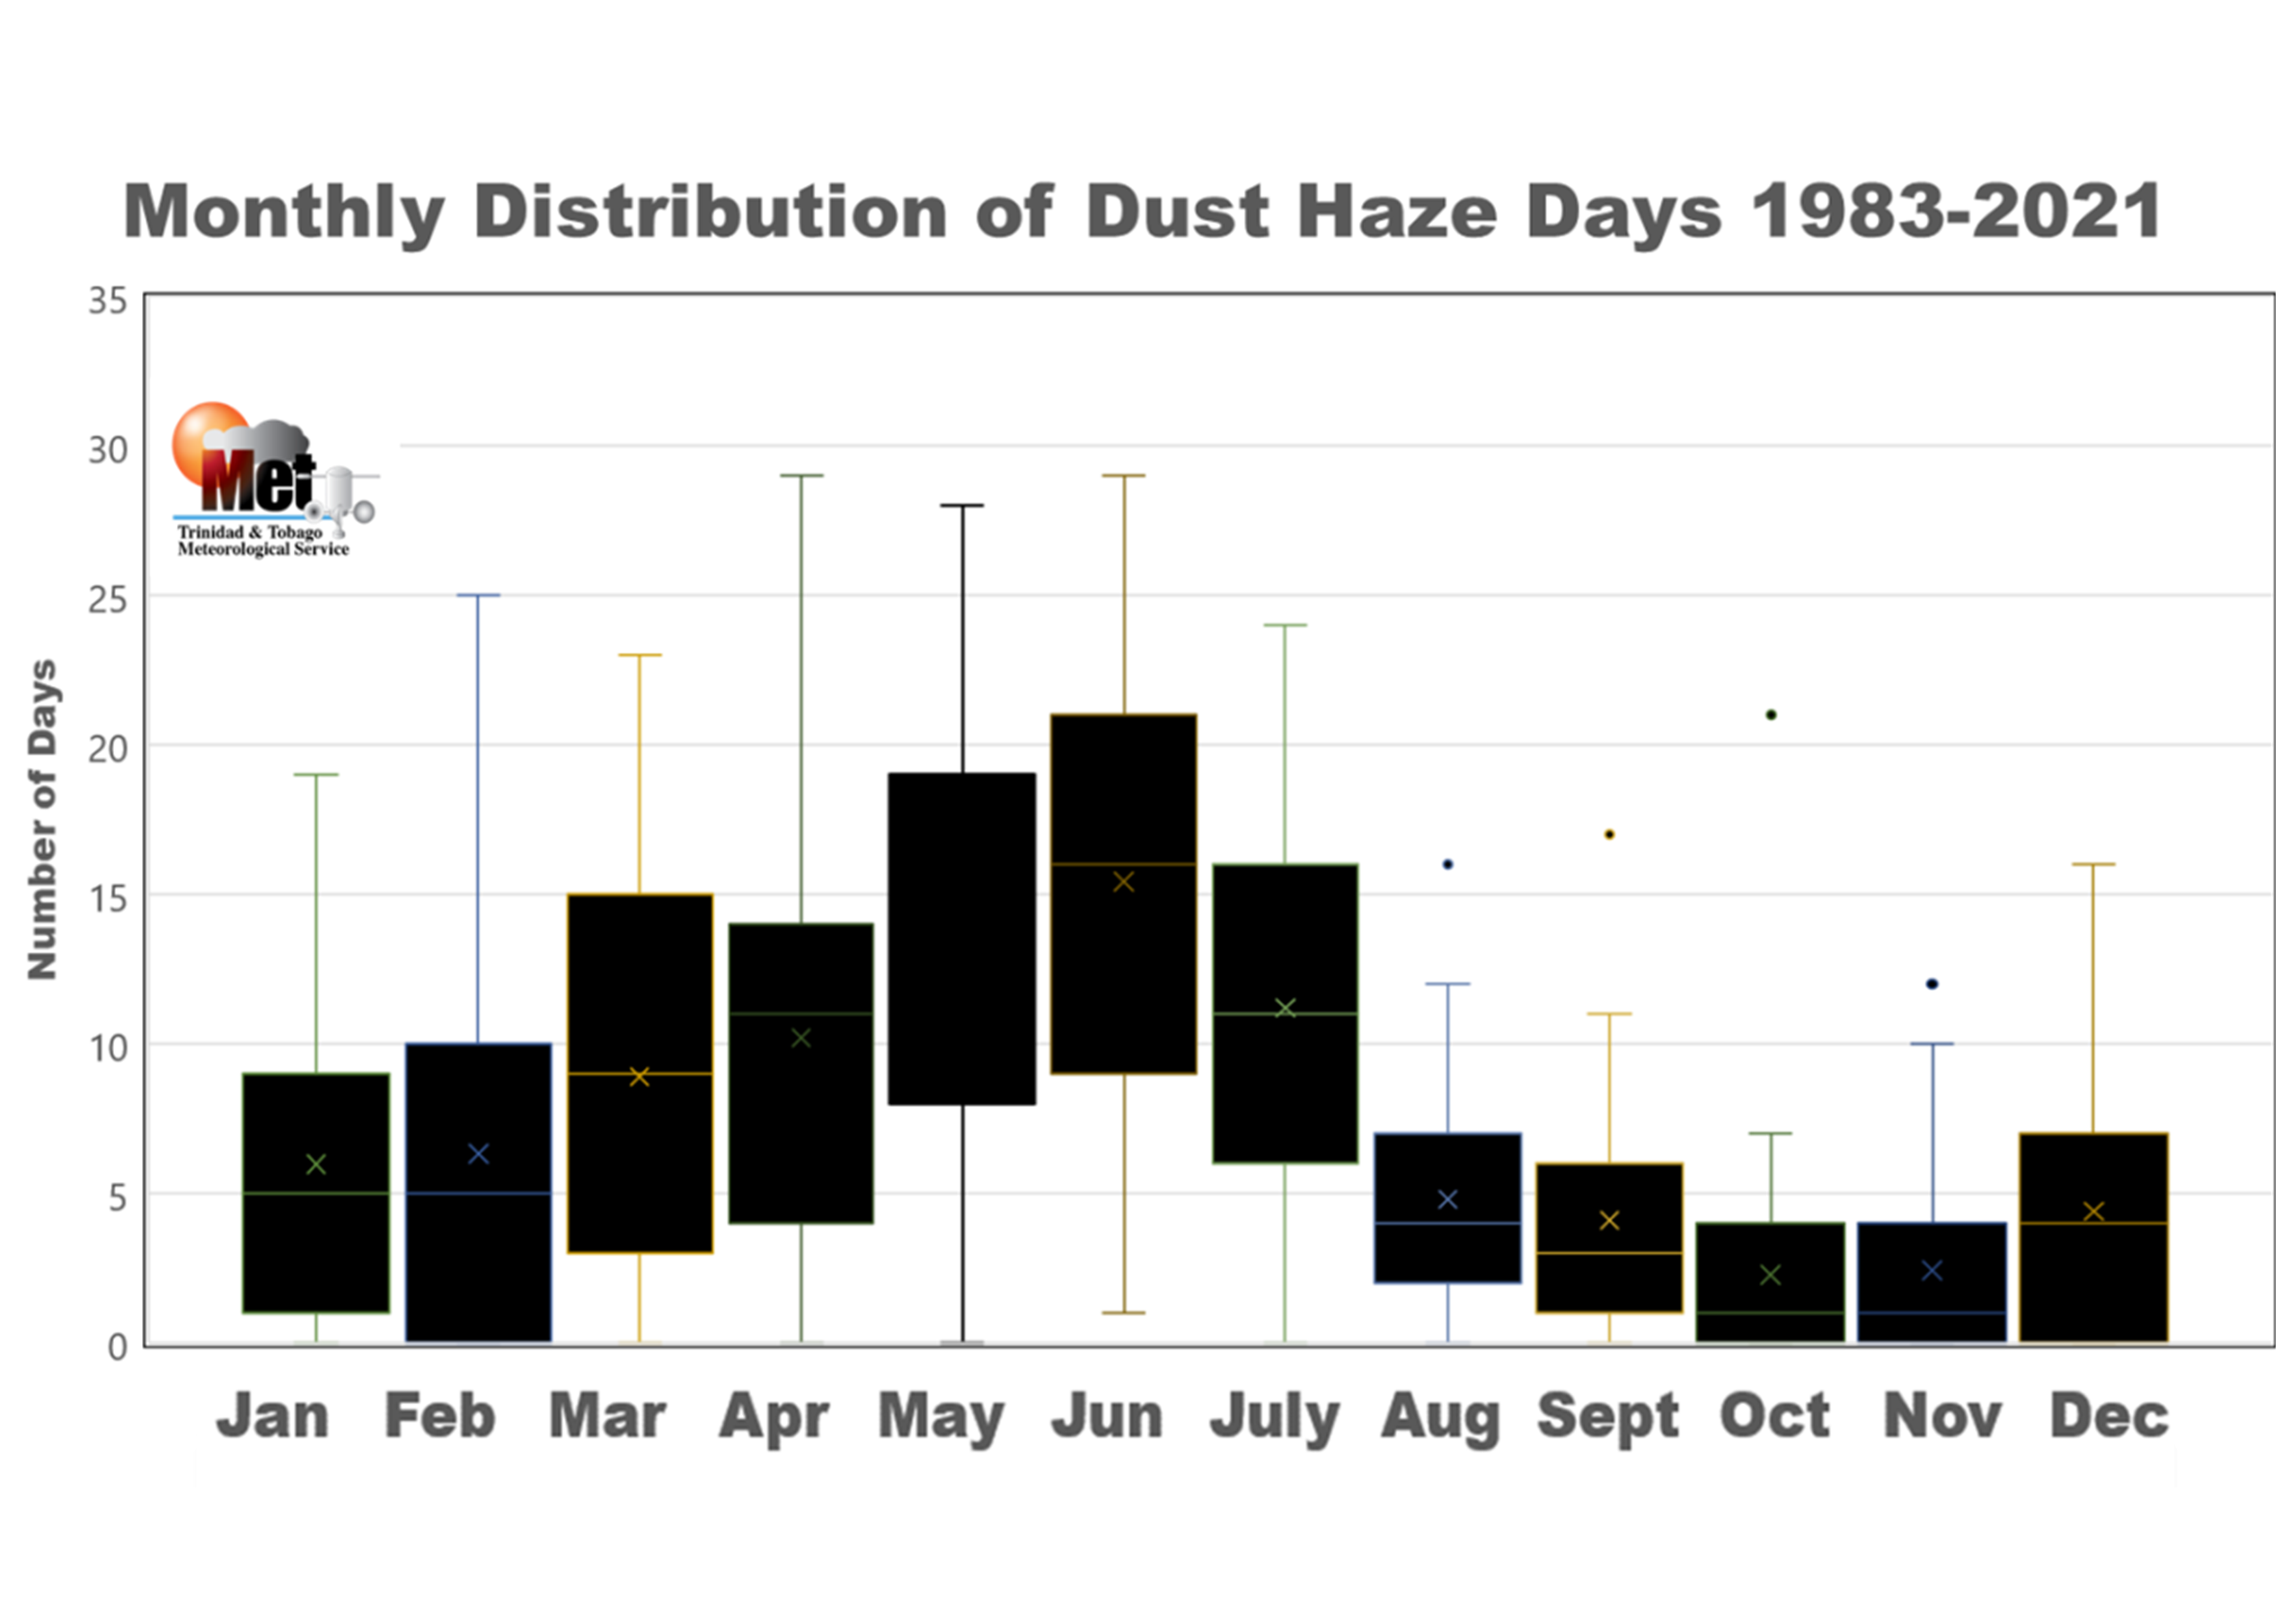
| This graphic shows the monthly distribution of dust haze days for Trinidad and Tobago between 1983 and 2021. Monthly average Saharan dust haze days and frequency varies significantly, but the proportion of dust haze days is highest in June followed by May and July. This period is is the peak of the local Saharan Dust Haze season. |
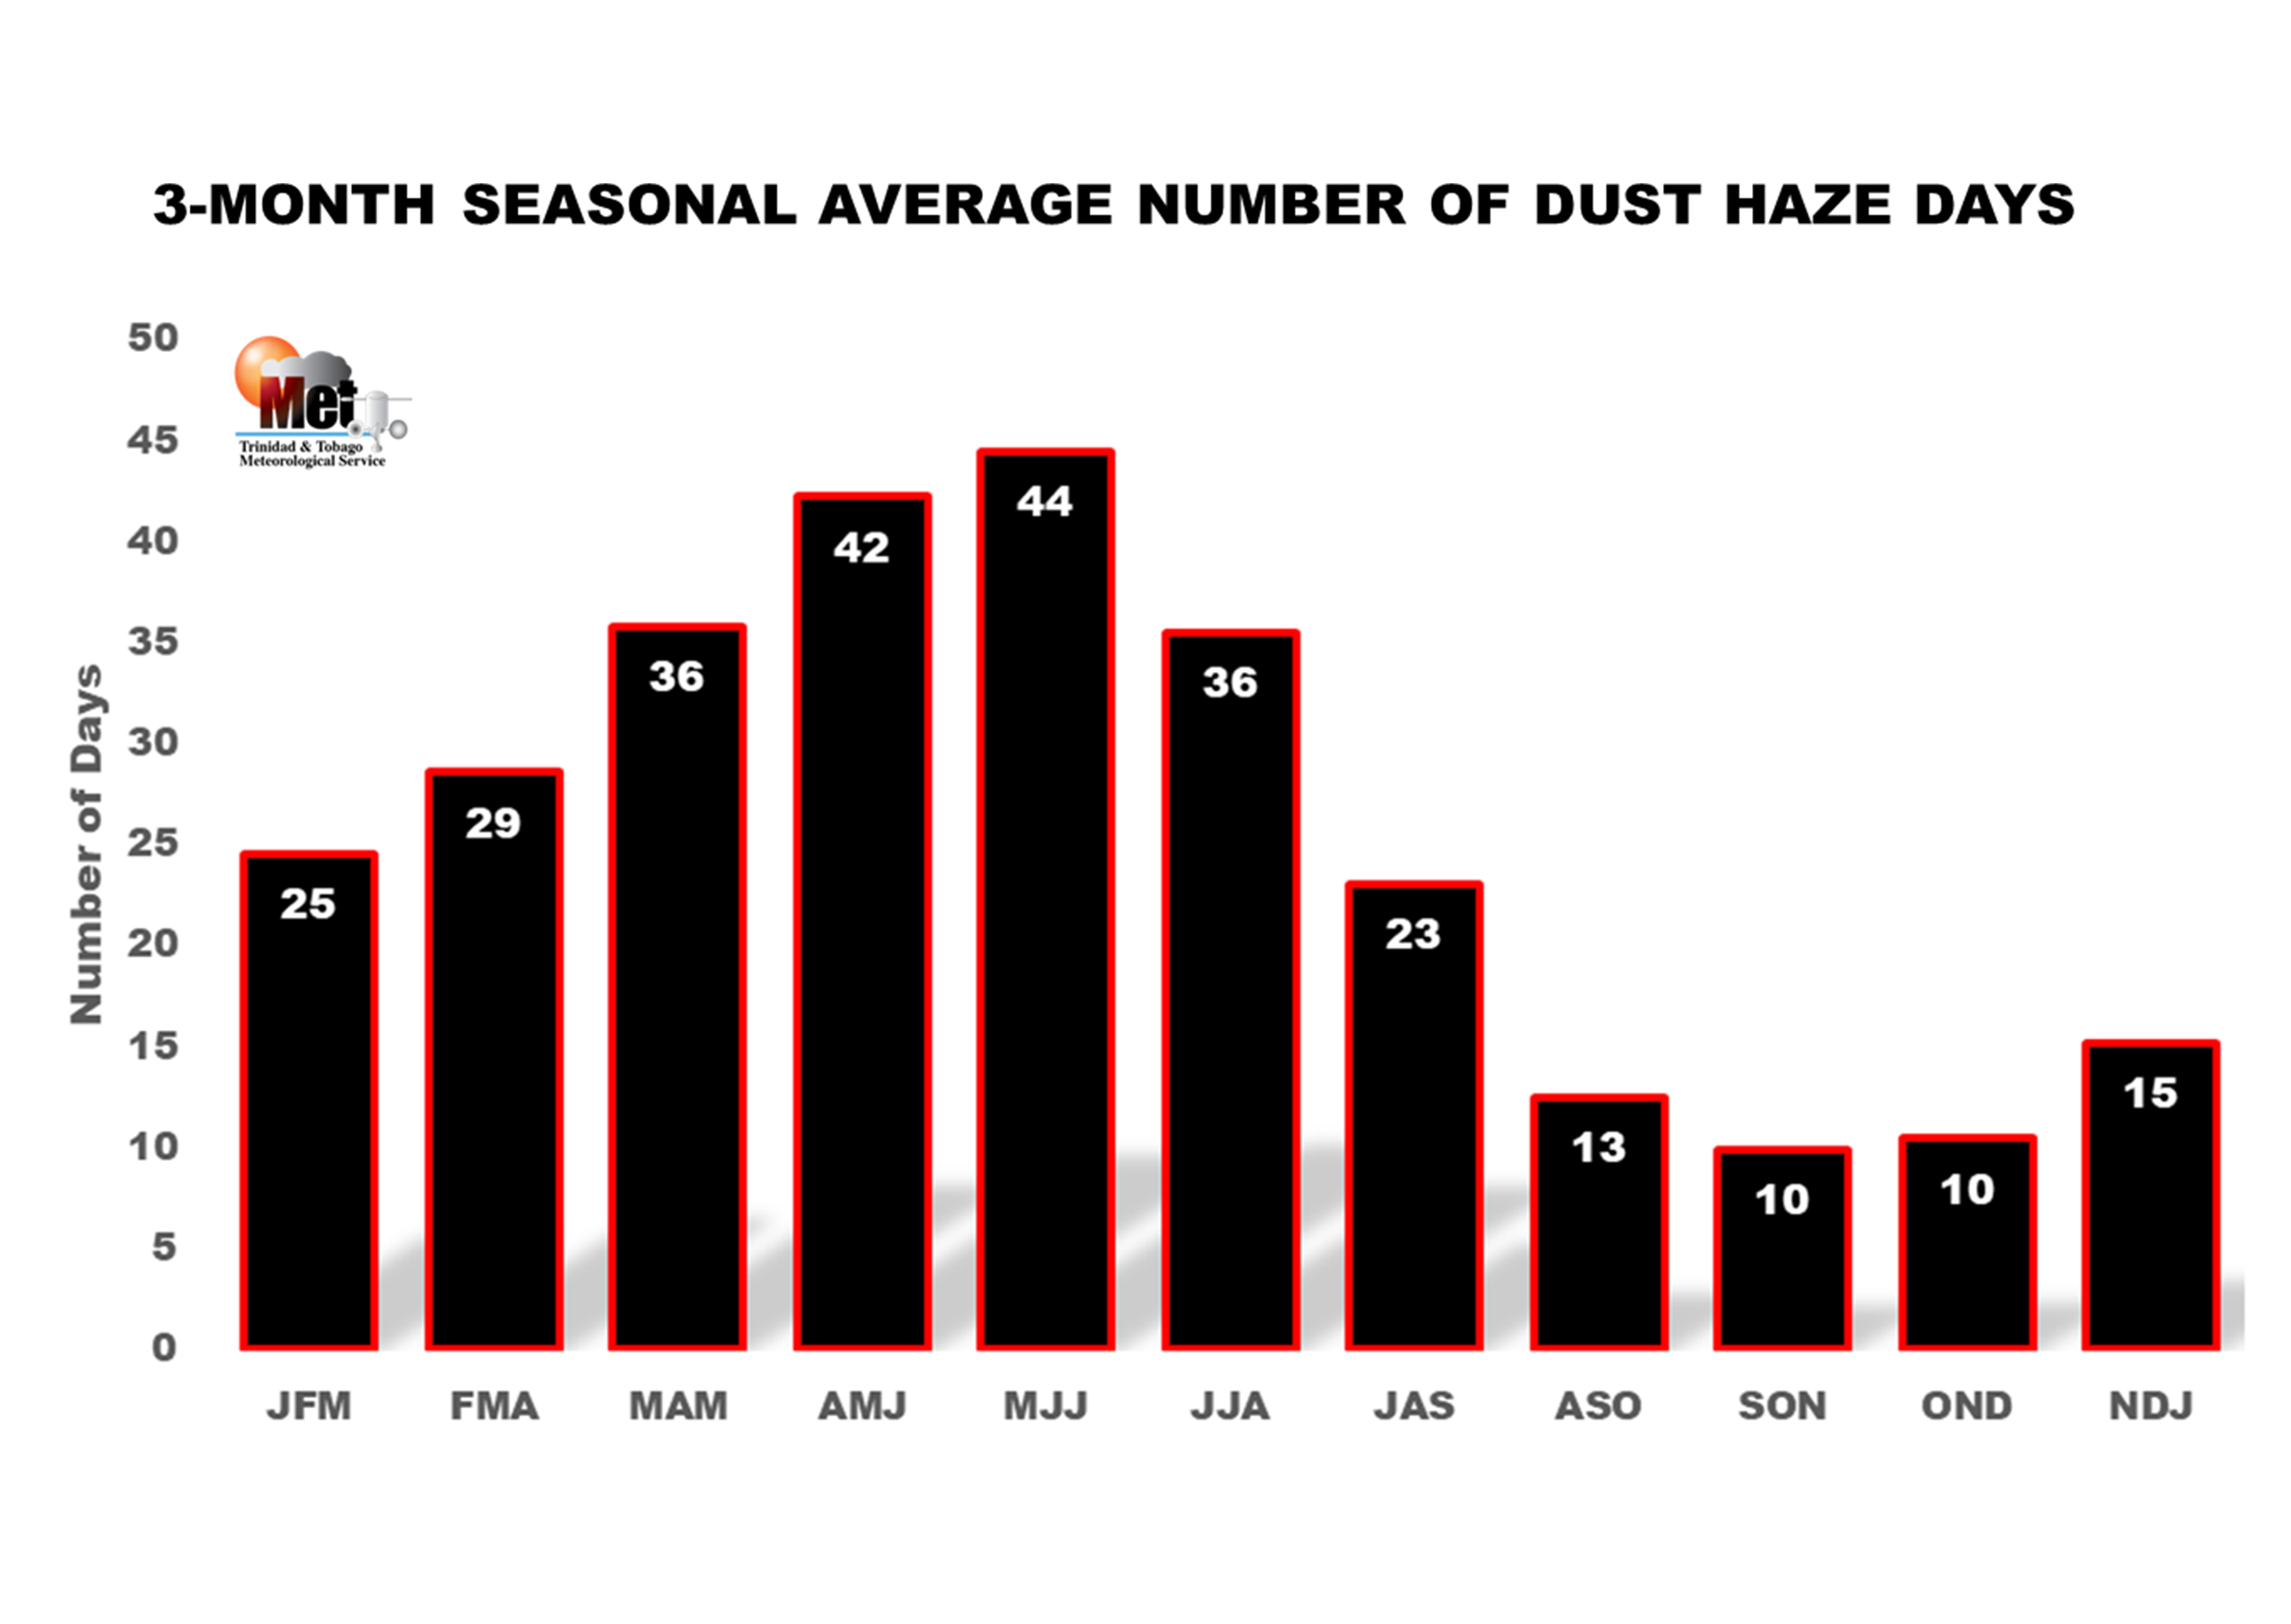
Long-term averages of the number of dust haze days for 3-month seasons are shown in this graph. The peak of the local Saharan Dust Haze season is May-June-July, which on average gets 44 dust haze days. |
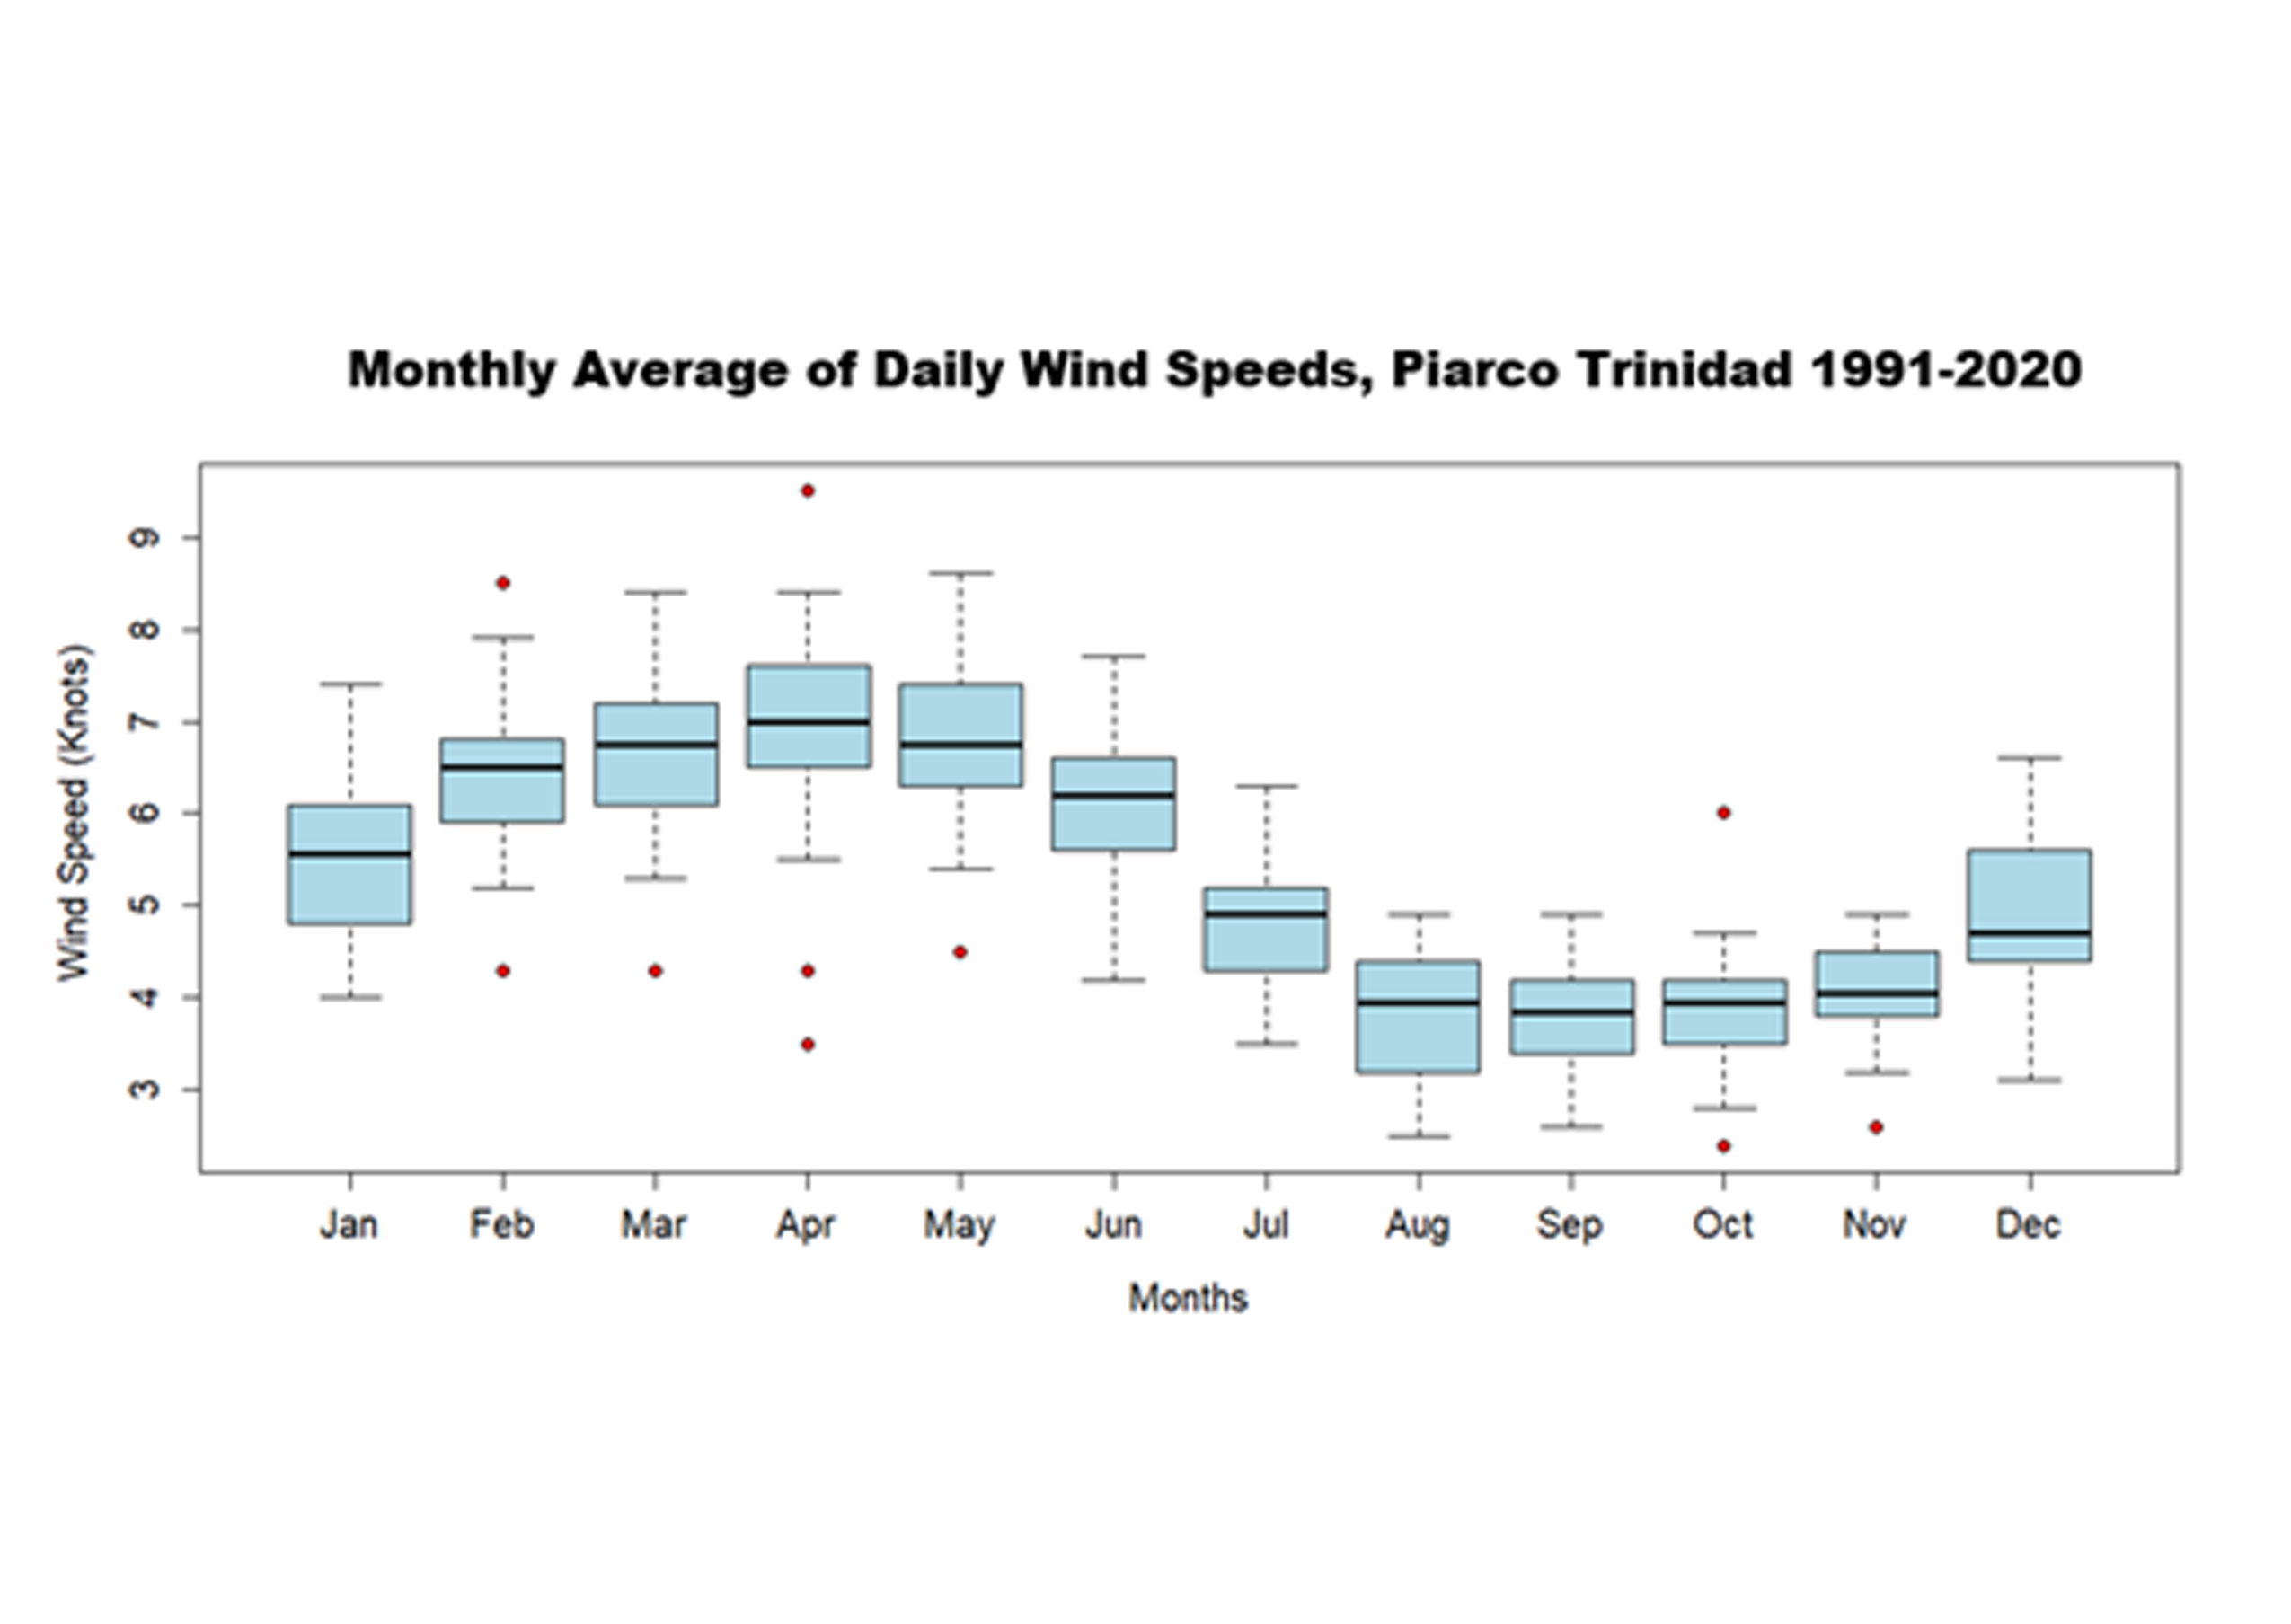
| Trinidad and Tobago Monthly Average of Daily Wind Speeds |
| Monthly Average of Daily Wind Speeds |
Hourly surface wind speed observations |
 |
 |
| The graphic shows the boxplot of monthly averaged surface wind speeds measured at the standard 10-meter height at the Piarco Meteorological Office over the period 1991-2020. The minimum and maximum values are indicated by the ends of the whiskers, with the mean, 25th, and 75th percentile values marked by the middle, lower and upper part of the box, respectively. On average, the month of April produces the highest monthly average wind speeds, while September tends to have the lowest average wind speeds. The dry season usually has the strongest winds with March to May having the strongest wind speeds overall. The months of August to October in the wet season usually have the lowest wind speeds. Other station records are not considered here due to length of record discrepancies. |
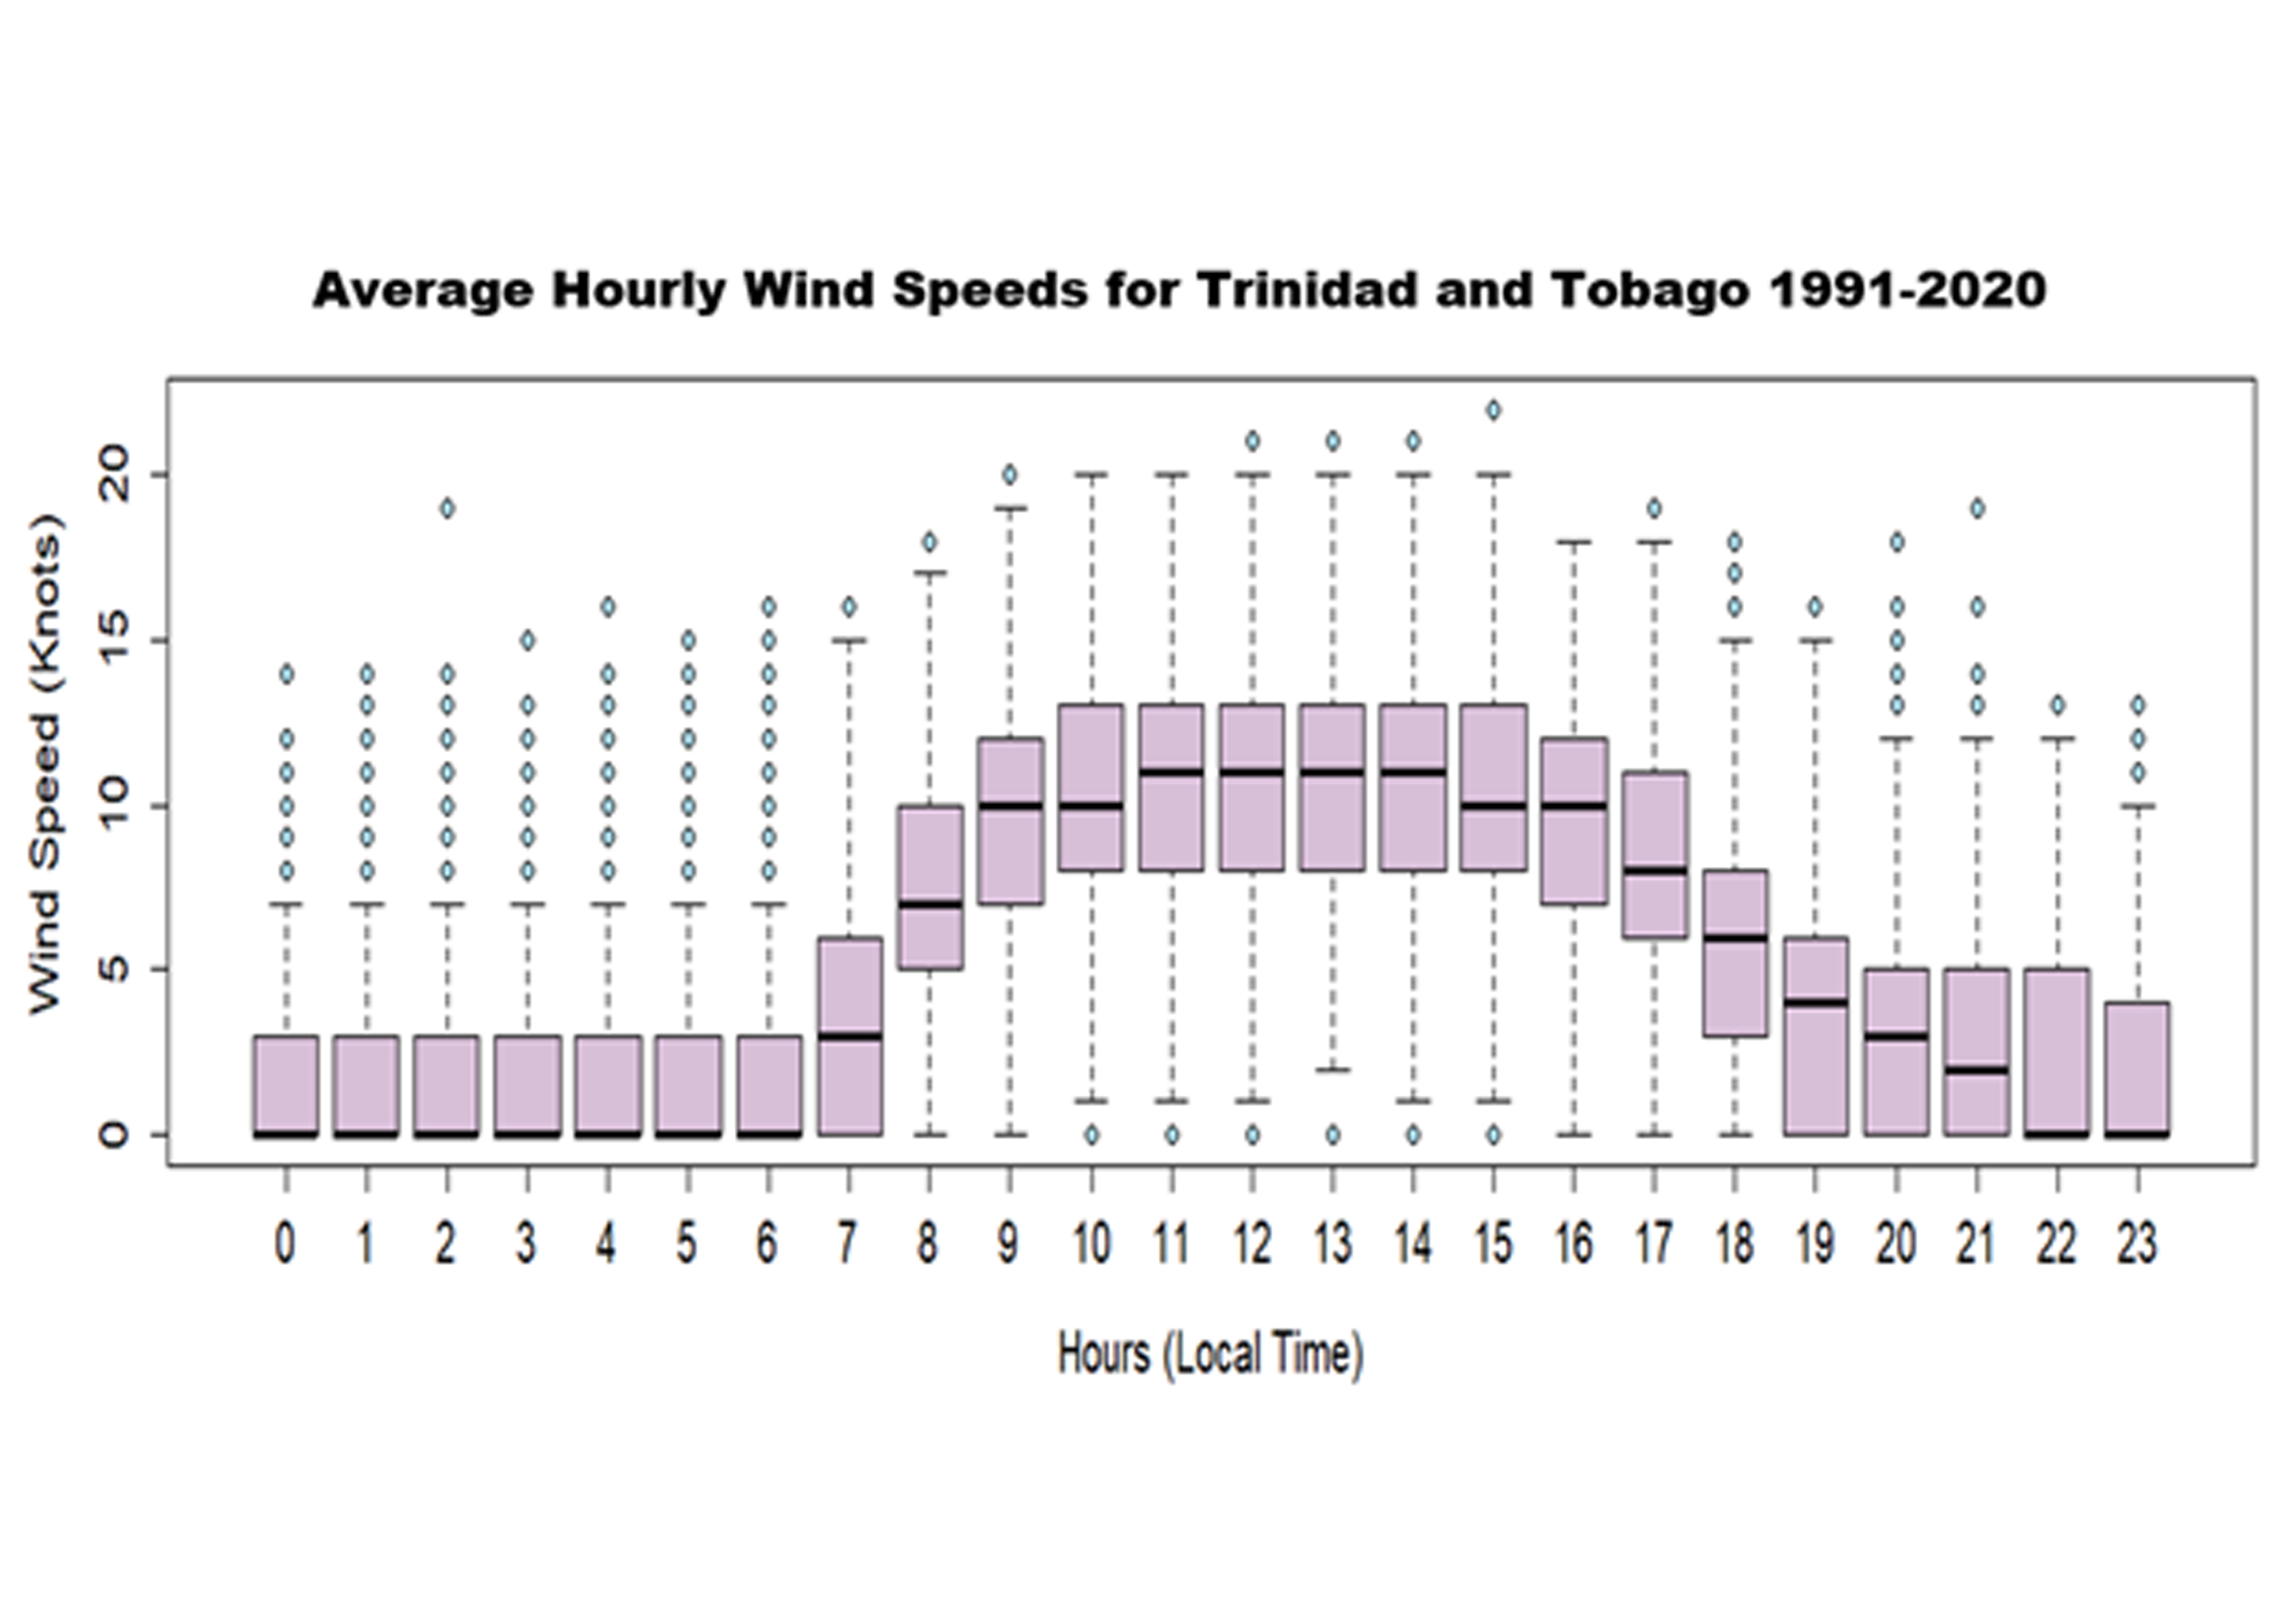
This graphic shows a boxplot of hourly mean wind speeds for Trinidad from 1991to 2020. Hourly surface wind speed observations measured at the standard 10-meter height at the Piarco Meteorological Office over the period 1991-2020 show on average, the wind speeds to be strongest between 11:00 am and 2:00 pm and lowest between midnight and 6:00 am. Hourly extreme wind speeds can exceed 20 knots during the day. |
| Trinidad and Tobago Wind Roses |
| These wind roses, graphically show the predominant wind direction and speed of the wind in Trinidad and Tobago and provide the best information regarding the percentage of time each wind direction and speed can be expected when averaged (standard climate normal 1991-2020) annually and at the dry and seasons scales in Trinidad and Tobago. |
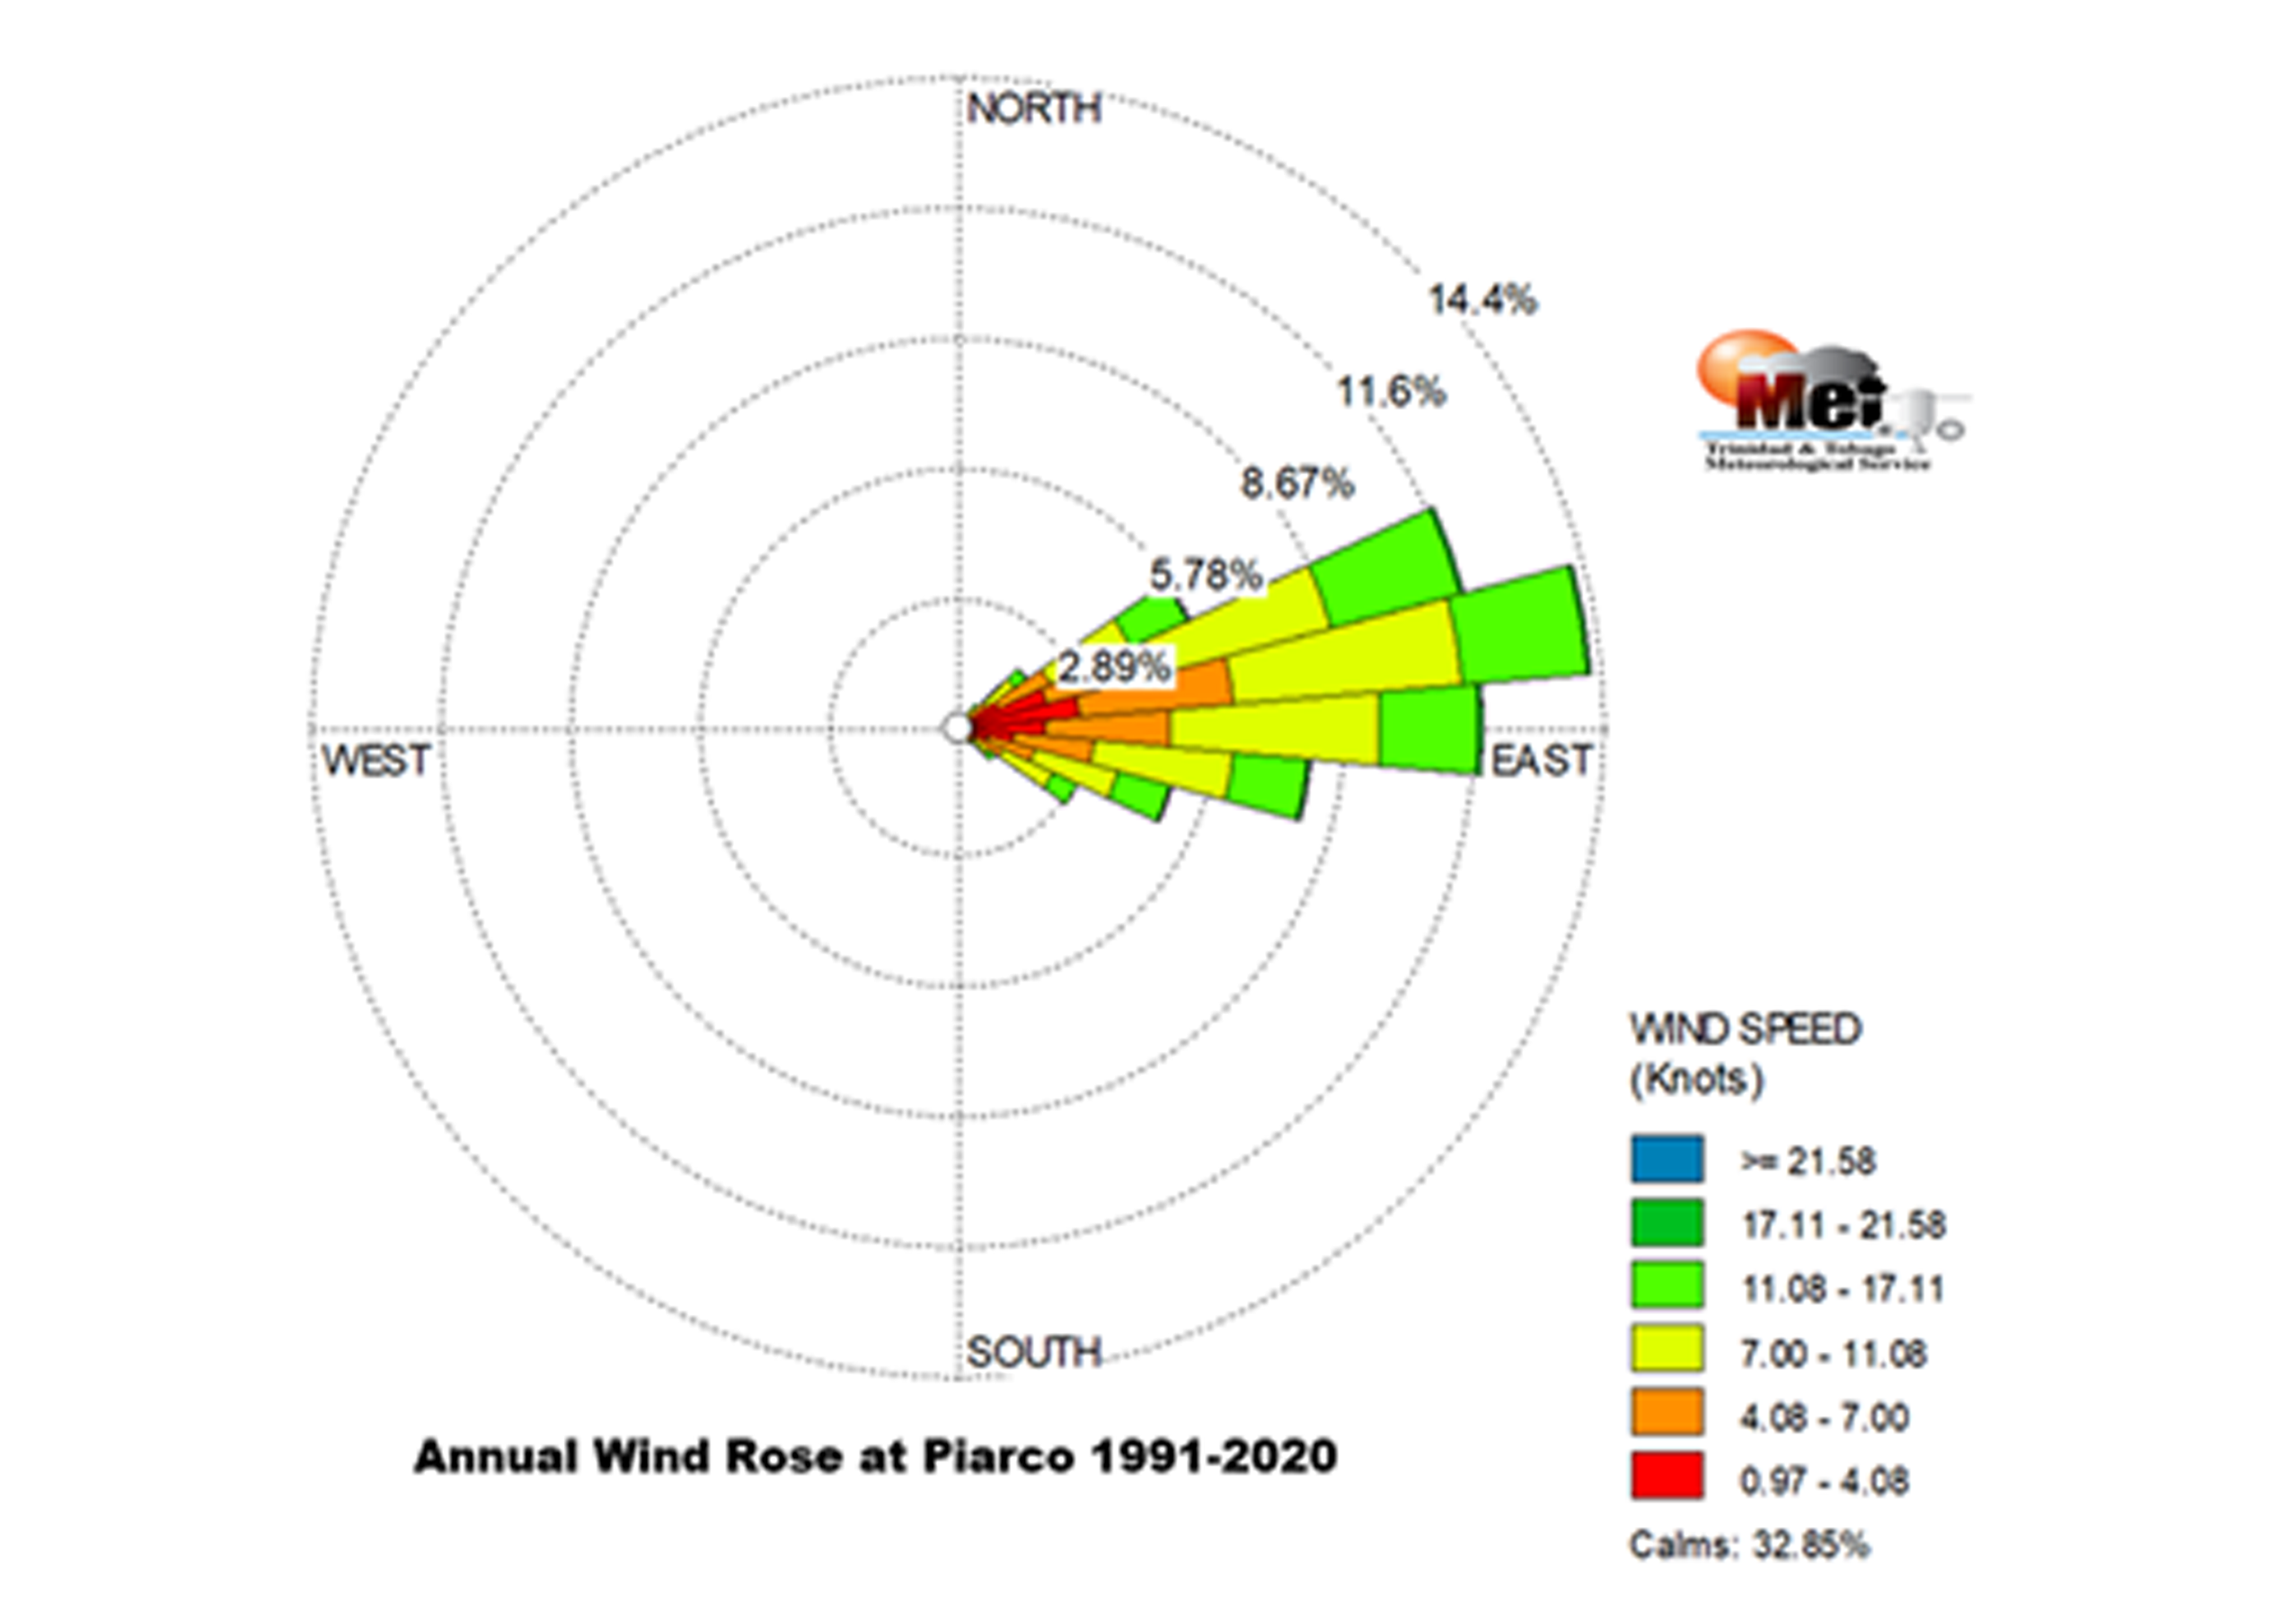
| Annual Wind Frequency Rose 1991 -2020 |
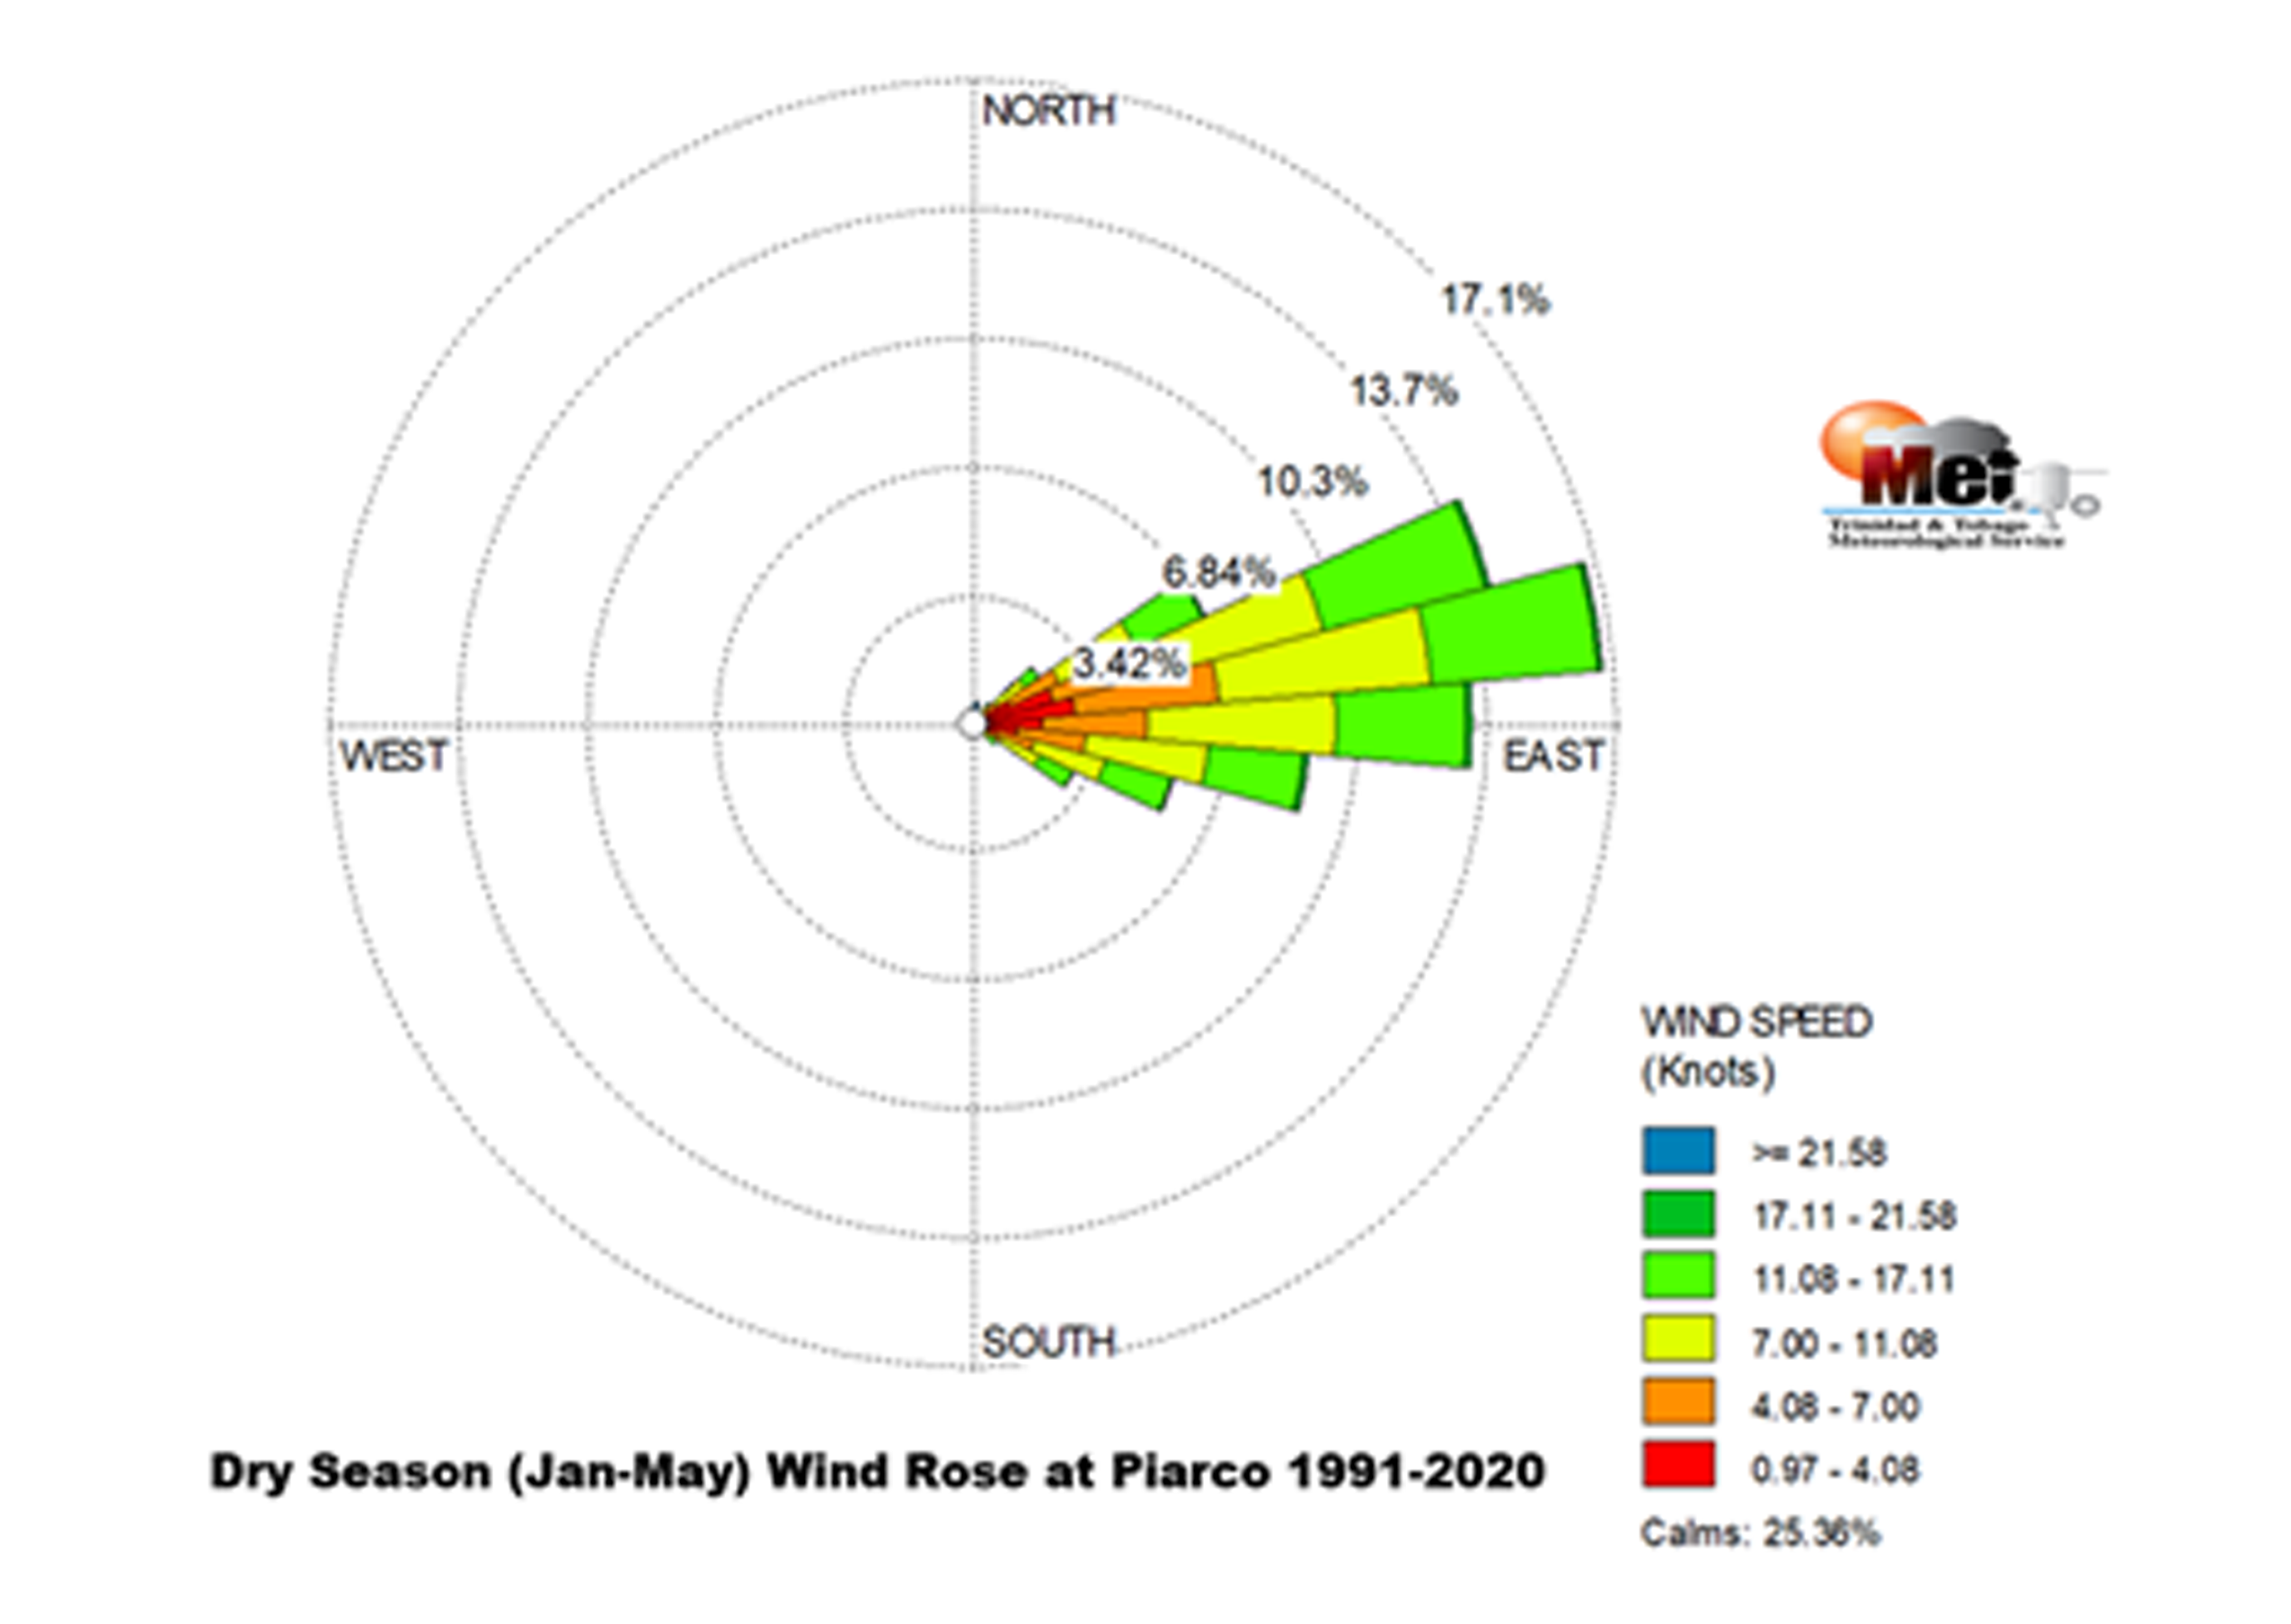
Wind frequency Rose for the Dry Seasons 1991 – 2020 |
Wind frequency Rose for the Wet Seasons 1991 – 2020 |
 |
 |
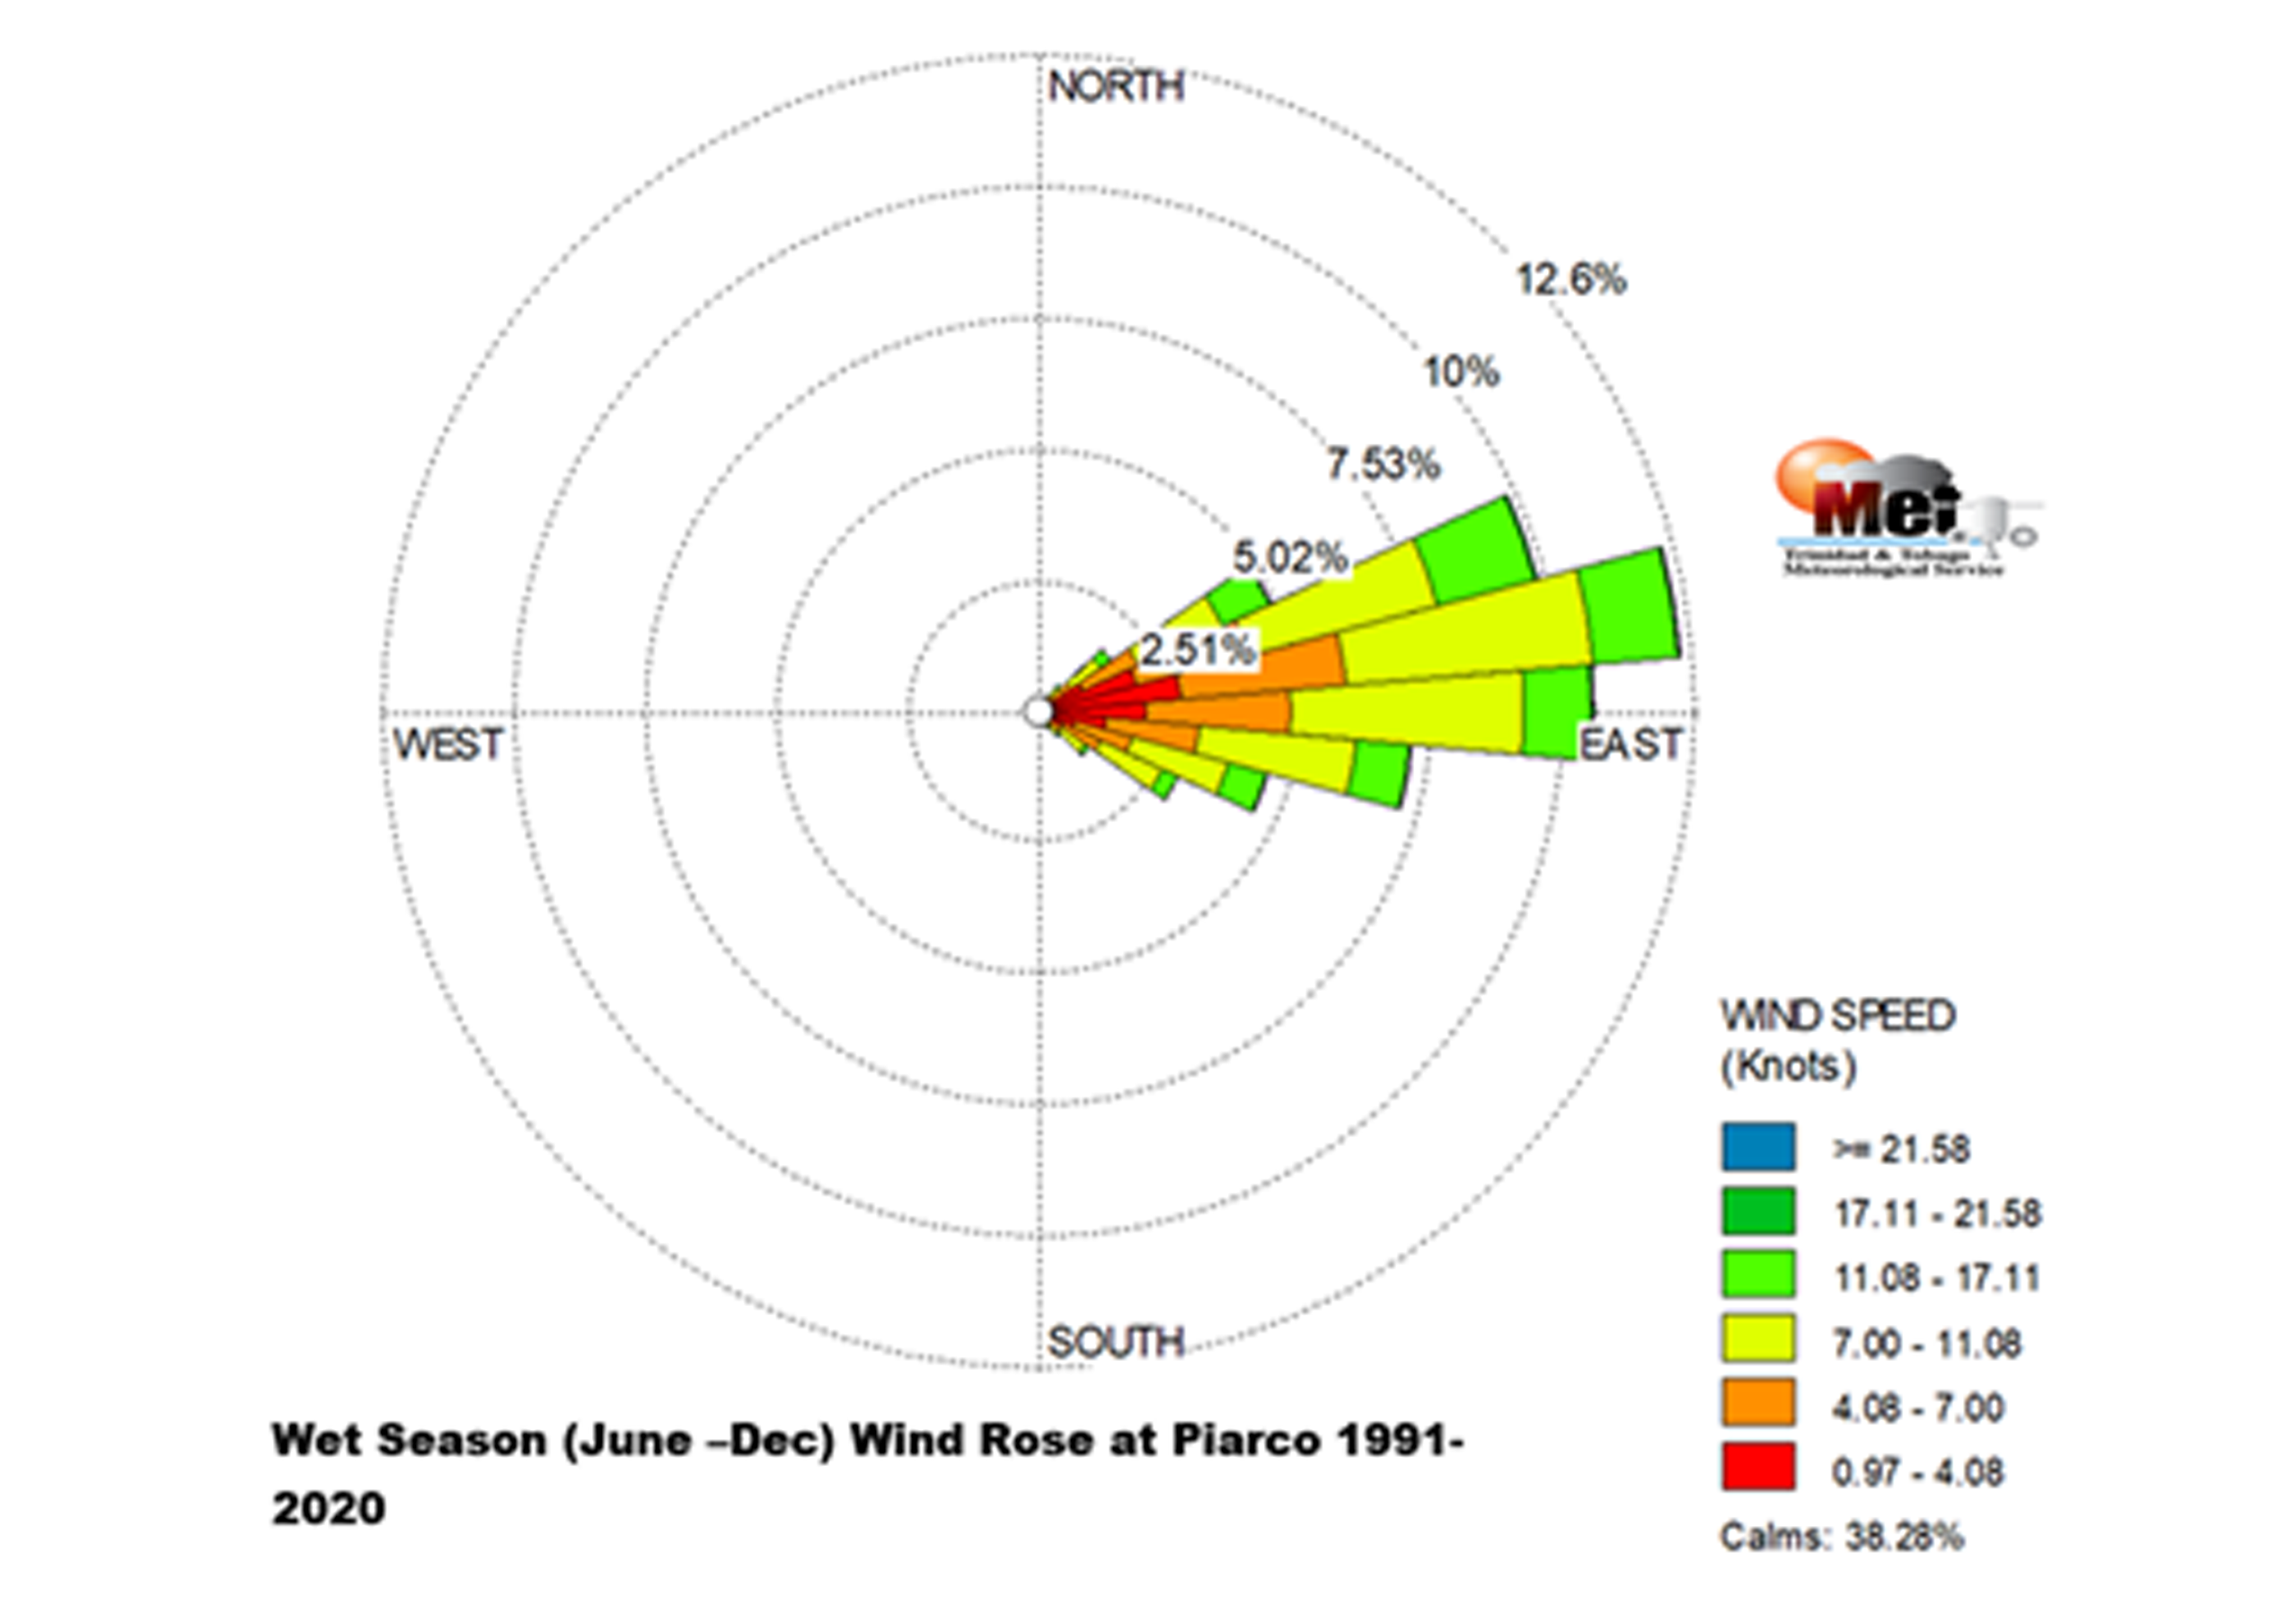 |
| The annual, dry and wet season wind roses show that the winds blew most frequently from east-north-east and most frequently at 7-11 knots (yellow). |
| Main Drivers of Trinidad and Tobago Climate, Rainfall and Temperature Variability |
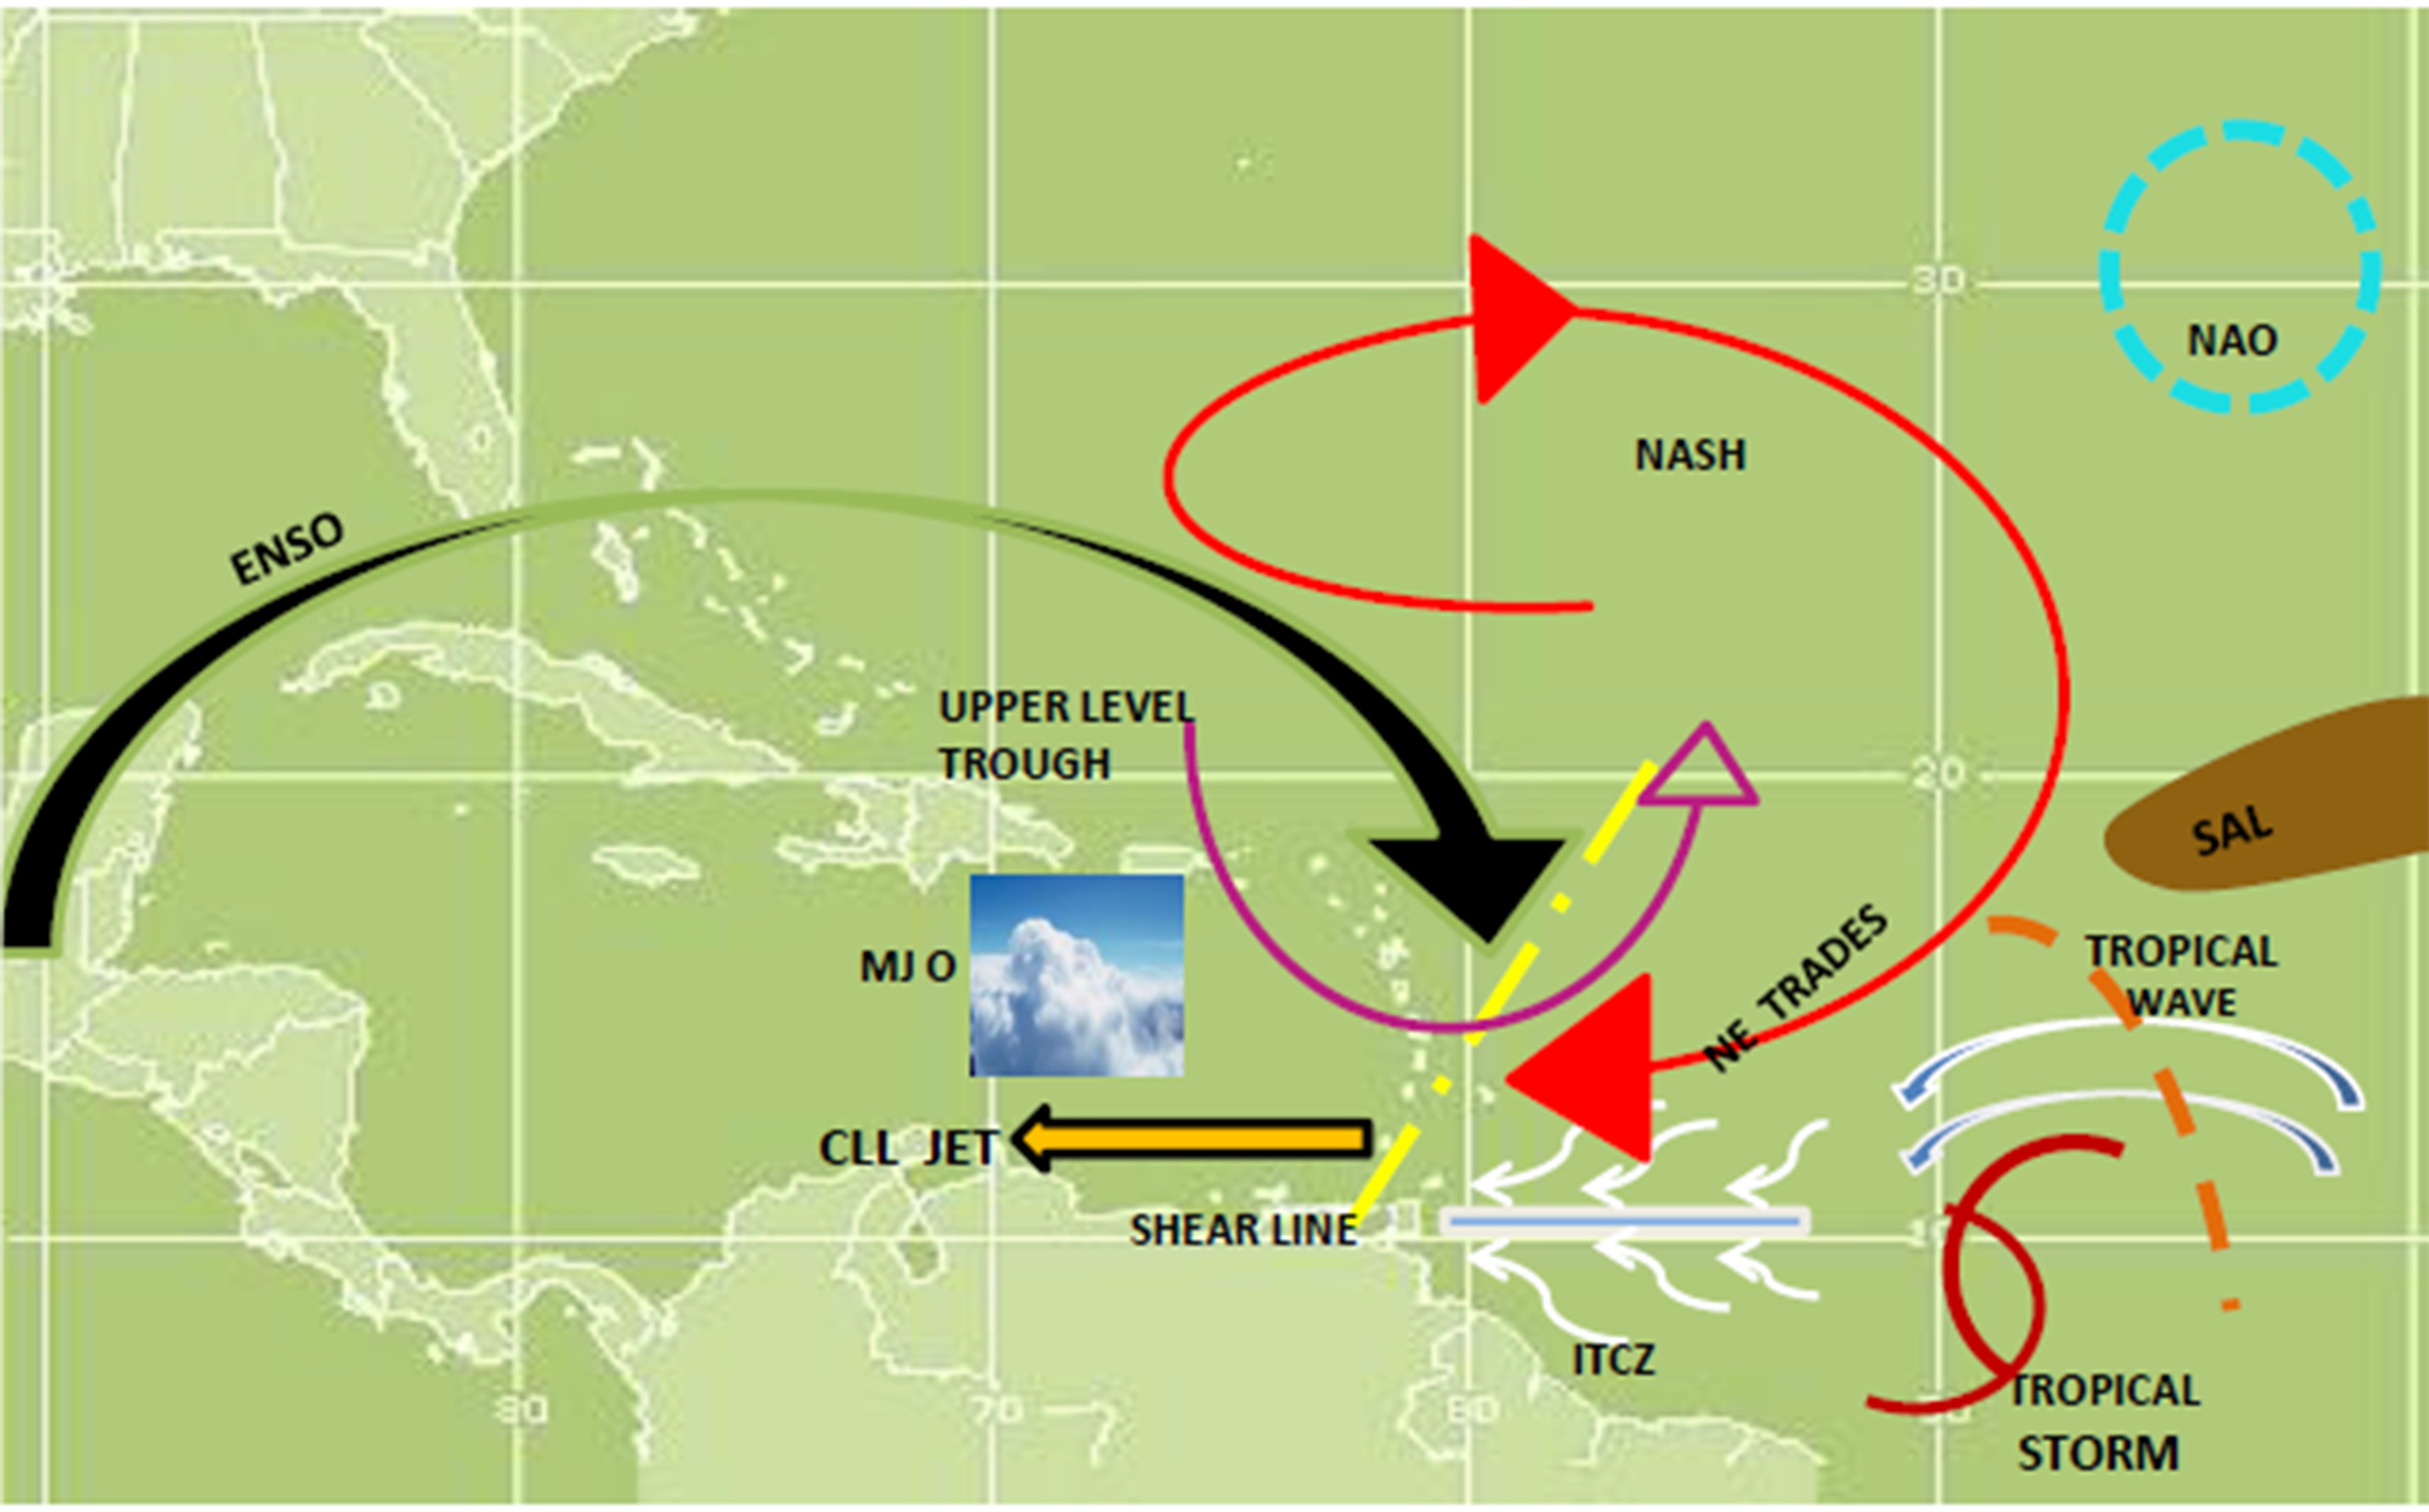 |
| Trinidad and Tobago’s climate has high year to year and seasonal variability, with rainfall having large spatial and temporal variability, over relatively small areas. The main drivers and influencers are presented in the schematic, but these are not all the influencers. The schematic represents the main drivers of rainfall and temperature variability over Trinidad and Tobago. These include the El Niño Southern Oscillation (ENSO), North Atlantic Sub-tropical High Pressure system (NASH), North East Trades, North Atlantic Oscillation (NAO), Inter-Tropical Convergence Zone (ITCZ), Madden Julian Oscillation (MJO), Caribbean Low Level Jet (CLL), Tropical Upper-Tropospheric Trough (TUTT), Upper Level Trough, Shear Lines, Tropical Waves, Tropical Cyclones and Saharan Air Layer; but these are not all the influencers. |
Last updated: Friday, 03rd June 2022