CLIMATE CHANGES IN TRINIDAD AND TOBAGO
Trinidad and Tobago's close proximity to the equator enables the country to have two climate types producing two opposing seasons. These seasons are differentiated by distinct dry and wet season regimes.The dry season which occurs during January to May is symbolized by a tropical maritime climate that is characterized by moderate to strong low level winds, warm days and cool nights, with rainfall mostly in the form of showers due to daytime convection.
A modified moist equatorial climate characterized by low wind speeds, hot humid days and nights, a marked increase in rainfall which results mostly from migrating and latitudinal shifting equatorial weather systems, symbolizes the wet season during June to December.
The periods late May and December are considered as transitional periods to the wet and dry seasons respectively. Variations in these two climatic seasons between the islands of Trinidad and Tobago are primarily as a result of difference in land size, orography, elevation, orientation in terms of the trade winds and geographical location.
Within the wet season is the hurricane season which runs from June to November, peaking between August and October. Trinidad’s geographical location puts it on the southern periphery of the North Atlantic hurricane basin. As such, Trinidad is not affected directly by storms as frequent as Tobago; however, peripheral weather associated with the passage of tropical storm systems impacts Trinidad and Tobago similarly.
Temperature Patterns
Trinidad and Tobago's daily temperature cycle is more pronounced than its seasonal cycle. The long-term mean (1971 - 2000) annual maximum and minimum temperatures are 31.3°C and 22.7°C, respectively, with a mean daily temperature of 26.5°C. Generally, wet season temperatures are warmer than dry season temperatures, with September being the warmest wet season month and March the warmest in the dry season.
Rainfall Distribution
Annually and seasonally, Trinidad is wetter than Tobago; however, both islands exhibit a distinct bi-modal rainfall pattern, with early (June) and late (November) rainfall season maxima. Trinidad's primary rainfall peak occurs in June, while Tobago's peak is in November.
Weather Influences & Changes
Annual rainfall totals are influenced by multiple competing weather systems, including: North Atlantic Sub-Tropical High (NASH) pressure cell (position & strength) Inter-Tropical Convergence Zone (ITCZ) (seasonal movement) Westward propagating tropical waves and cyclones Mid-Atlantic upper-level trough system Localized sea-breeze effects and orographic influences.
Dry Season and Wet Season Transition
During the dry season, the NASH pressure cell shifts southward and expands, leading to dry conditions with strong trade winds and reduced moisture. By May, the NASH starts moving poleward, allowing rain-bearing systems (like the ITCZ and tropical waves) to move northward, marking the transition into the wet season.
CLIMATE VARIABILITY
refers to departures from the mean position and higher order statistics such as standard deviations, as well as changes in the occurrences of extremes. Moreover, it is used to indicate departures of the mean etc over a given time period (for instance a month, a season, a year) from the long term statistic for a matching time period. Climate variability is thus a measure of the departures which are usually called anomalies. Climate variability is caused by natural occurring internal processes which occur on all time and spatial scales outside of that of individual weather events, and involves many modes of variability involving components of the climate systems such as the atmosphere and the ocean. An example of a naturally occurring internal process which drives climate variability in Trinidad and Tobago is the coupled ocean/atmosphere El Nino-Southern Oscillation (ENSO- El Nino or La Nina) phenomenon.
CLIMATE CHANGE
refers to a change in the mean condition of the climate that can be identified by a change in the mean and or variability of its properties that is statistically significant and this change must continue for an extended period, typically decades or longer. It may be due to naturally occurring internal processes such as volcanic eruptions which can act to cool the atmosphere; or external forcing such as changes in solar radiation received at the earth surface which can be influenced for instance by change in the tilt of the earth axis away from its orbital plane which occurs naturally. Naturally occurring climate variability can also induce climate change. Climate change may also be due to persistent external influences which do not occur naturally such as the change in the composition of the atmosphere or change in land use generated by human activity such as the burning of fossil fuel and deforestation.
DISTINCTION
The major difference between climate variability and climate change is the persistent nature of the anomaly and the fact that the change cannot be explained by naturally occurring internal variability processes alone. For instance, rare events occur more often or less often e.g. the maximum temperatures increasingly breaking records each year or nights are consistently becoming warmer each year. Climate change detection is the process of demonstrating that the climate has changed in some defined statistical sense without providing a reason for the change. Climate change attribution is the process of establishing the most likely cause for the detected change with some defined level of confidence.
PROBLEM STATEMENT
This policy document aims to enhance the monitoring and assessment of dry spells in Trinidad and Tobago to minimize crisis responses. Dry spells impact water management, agriculture, health, and the economy, with extreme droughts posing significant risks, especially with climate change. Given population growth and increased agricultural demands, establishing a dry spell early warning system is crucial. Current procedures for identifying dry spells are inadequate, limiting science-based monitoring. This document addresses that gap by aligning Trinidad and Tobago’s meteorological service with international standards, ensuring reliable rainfall deficit and surplus monitoring for informed decision-making.
INTRODUCTION
Before implementing a dry spell and drought policy, it is crucial to understand their differences, the complexity of drought, and its various types. According to the WMO, a dry spell lasts at least 15 days without significant rainfall, whereas drought is an extreme climatic condition marked by prolonged low rainfall, insufficient to meet societal and environmental needs. Drought varies by sector: climatologists focus on rainfall deficits, agriculturalists on crop impact, hydrologists on groundwater levels, and sociologists on social expectations. Types include meteorological, agricultural, hydrological, and socio-economic droughts. This policy specifically addresses meteorological drought and dry spells, using the Standard Precipitation Index (SPI) as the primary monitoring tool, supplemented by other indices when necessary.
DEFINITIONS
Meteorological drought refers to short-term droughts or dry spells caused by significantly below-average rainfall over an extended period, ranging from months to years. It is measured by the degree of dryness and duration of the dry period. Since rainfall patterns vary by region, meteorological drought is region-specific and requires a deep understanding of local climatology. Its characterization may consider factors such as the number of days with minimal rainfall or deviations from average rainfall totals on monthly, seasonal, or yearly scales.
AGRICULTURAL DROUGHT
Agricultural drought is defined by the measure of the availability of soil water to plants or animals and occurs when there is not enough rainfall, soil moisture and difference between actual and potential evapo-transpiration to meet the needs of a specific plant or animal at a particular time. It can take place simultaneously or a little before or after a meteorological drought.
HYDROLOGICAL DROUGHT
Hydrological drought refers to deficits in surface and sub-surface water supplies based on measurements of stream flow, lake, reservoir and groundwater levels when rainfall is deficient during an extended period of time. Hydrological droughts are usually out of phase or lag the occurrence of meteorological and agricultural droughts.
SOCIO-ECONOMIC DROUGHT
Socio-economic drought definitions are associated with the effect of supply and demand of a product with elements of meteorological, agricultural and hydrological drought. Socio-economic drought occurs when demand for an economic good exceeds supply as a result of physical water shortage that is weather related and starts to affect people, both individually and collectively.
Meteorological Drought Assessment
Trinidad and Tobago's meteorological drought cannot be defined by consecutive dry days, as dry spells (14–20 days) are common in both dry and wet seasons. Instead, drought is assessed by deviations from average monthly or seasonal rainfall.
Monitoring and Classification
The TTMS monitors drought onset, duration, and severity using the Standard Precipitation Index (SPI), which compares rainfall over specific periods to historical averages. The SPI standardizes rainfall anomalies, with negative values indicating drought conditions and positive values indicating surplus rainfall.
SPI-Based Drought Classification
TTMS classifies dry spells and droughts using a 2-month SPI:
- -1.0 to -1.24: Dry spell
- -1.25 to -1.49: Moderate dry spell
- -1.50 to -1.99 (two consecutive periods): Drought
- ≤ -2.0 (two consecutive periods): Severe drought
- -1.50 to -1.99 (one period): Incipient drought (watch/alert)
- ≤ -2.0 (one period): Incipient severe drought
Additional Considerations
Other climatic factors, including temperature, humidity, wind, and soil moisture, along with past dry spell impacts, help refine drought assessments.
Conclusion
The policy shifts from a reactive to a proactive approach by establishing an early warning system for dry spells and meteorological droughts. It aims to enhance science-based monitoring, improve event assessments, and support short- and medium-term responses across sectors. The policy provides guidance on detecting onset, duration, and severity, ensuring timely communication to stakeholders in climate- and water-sensitive sectors.
OPERATIONAL POLICY
In response to the need for a practicable dry spell and meteorological drought monitoring and forecast application, the Acting Director, Trinidad and Tobago Meteorological Service, recommends the following operational policy:
SPI for Drought Monitoring
The Trinidad and Tobago Meteorological Service (TTMS) adopts the Standard Precipitation Index (SPI), as recommended by the World Meteorological Organization (WMO), for monitoring and predicting dry spells and meteorological droughts. The SPI helps compare rainfall over specific durations to long-term historical records at the same location.
SPI Calculation Overview
The SPI measures how much rainfall deviates from the historical average in standard deviation units. Since rainfall data is skewed, it is first transformed using a gamma function before calculating:
Where:
- A = Total rainfall for the period being analyzed
- A (Avg.) = Historical average rainfall for the same period
Implementation Strategy
The TTMS will implement this policy through regular monitoring, data collection, and stakeholder communication. The SPI will be calculated monthly and used to provide early warnings for drought conditions across Trinidad and Tobago.
VARIABILITY DRIVERS
Most of the features which account for the variability of temperature and rainfall in Trinidad and
Tobago originate in the tropics, but global features also impact the climatic variability. Phenomena such as El Niño-Southern Oscillation (ENSO) and the North Atlantic Oscillation (NAO) are two of the major
drivers of climate variability in Trinidad and Tobago. It has also been shown that the Madden-Julian Oscillation (MJO), the Saharan Air layer (SAL), tracks taken by tropical storms, migratory behaviour of the Inter-tropical
Convergence Zone (ITCZ) and behaviour of the North Atlantic Sub-Tropical High (NASH) also influence the climate variability in Trinidad and Tobago.
Studies have shown that the El Nino phase of the ENSO modifies the annual cycle of rainfall over the Caribbean greatest, with varying results for different areas.
The relationship between El Nino and the rainfall cycle starts with a drying trend during the latter half of the wet season which continues into the dry season and
ends with a strong wet signal during the earliest period of the new wet season; this relationship was observed in Trinidad and Tobago during the 2009-2010 episode of the most recent El Nino event.
With regards to La Nina, it has been found that the Southern Caribbean including Trinidad and Tobago exhibits wetter than normal late wet season and dry season; while the early wet season at the end of a La Nina event
is drier than normal. The link between the NAO and Caribbean rainfall is found in the relationship between pressure systems and rainfall and temperatures in the region.
A positive index is indicative of anomalously high pressures across the region resulting in a reduction in rainfall since higher pressure introduces stronger winds, more evaporation,
cooler Sea Surface Temperatures (SST's), and less ascending motion. When the index is negative, rainfall in the early period of the wet season is enhanced since lower anomalous pressure
introduces lighter winds, less evaporation, warmer SST's, and more ascending motion.
TRENDS
Several studies exist which have found recent changes in the climate in Trinidad and Tobago,
especially with respect to temperature trends. Temperatures in Trinidad and Tobago have been found to have increased steadily from 1946 to 1995. More recently, it has been shown that over the last three decades there has been an
upward trend in temperatures that is statistically significant and which has been induced by a steady increase in daily minimum temperatures ; this latter finding suggests that nights have become warmer.
Other studies are also
consistent with the warmer temperatures. Mc Sweeney 3using a Global Climate Model (GCM) found significant increases in the mean annual temperature in Trinidad and Tobago with an increase around 0.6 oC since 1960; an average of 0.13
oC per decade. The Trinidad and Tobago Meteorological Service (TTMS) also found that at Trinidad's, as well as, at Tobago's reference climatological stations, the annual mean air temperature has also warmed over the period 1981-2010
by 0.8 and 0.5 oC relative to 1961-1990 and 1971-1990, for Trinidad and Tobago respectively. The observed anomalous warming of 0.27 C per decade at the station in Trinidad and 0.17 oC per decade in Tobago are consistent with the IPCC
(2007) observed 0.2 oC per decade in the Caribbean region.
Rainfall in Trinidad and Tobago has not shown as distinct a change as has been observed with temperatures. It appears that changes in rainfall differ across various parts of the country and over different time periods.
During the 1960's to 80's it has been shown that Trinidad and Tobago annual rainfall totals increased, but subsequently decreased onward to the 1990's. More recently, rainfall in Penal in South Trinidad has showed a decreasing
trend while at Piarco in the north, an increasing trend was observed.
Another recent study conducted on behalf of the UNDP found fractional decreases in Trinidad and Tobago's rainfall over the last half century; however the trend
was not statistically significant. The TTMS 8 also found that there has not been any significant change in the annual mean rainfall totals in Trinidad over the period 1981 to 2010 compared to 1961-1990; however, there were larger
changes in the annual mean rainfall totals over the latter period.
These changes were driven by slight increases in the frequency of extreme dry and wet years, as well as, increases and decreases in extreme wet and dry years
rainfall totals respectively. In Tobago however, the rainfall pattern has shown a different behaviour;Tobago's annual mean rainfall has decline by 36.4 mm per decade during the 1981-2010 period compared to the long term average
of the 1969 to 1990 period, this was driven primarily by a decrease in the number of years with near normal rainfall.
Strong El Nino events in recent years have resulted in meteorological droughts in Trinidad and Tobago. It has also been shown that the El Nino of 1997/98 and associated drought conditions in Trinidad and Tobago were responsible
for the decline in sugar production during that period. The Drought event of 2010 in Trinidad and Tobago resulted in hundreds of acres of natural forest burnt. Drought conditions have also been advanced as the reason for lost
of near- shore habitat due to declines in freshwater. This was aided by saline intrusion in the Southern Caribbean and Trinidad and Tobago during 2009-2010. Increased sea surface temperatures during the summer of 2005 resulted
in severe coral bleaching in Tobago during the summer period. Recent increases in intense rainfall events have been associated with increased flooding in the region including Trinidad and Tobago and this has no doubt impacted
fresh water impoundments and water quality. The Caribbean region experienced an average sea level rise of about 10 cm over the twentieth century due to the warming; but this rise is not uniform throughout the region.
PROJECTIONS
Statistical downscaling of global climate model (GCM) HadCM3 using the A2 and B2 emission scenarios project a rise in temperature of between 1.5 - 2.0 Celsius in the Caribbean region including Trinidad and Tobago by the 2080's
compared to the 1980 to 1999 period. This amounts to a projection of 0.29 Celsius per decade. If these projections are realized it is possible that an approximate 8% increase in the length of the dry season by 2050 and consequently
a shorter wet season could result.
Projected trends in rainfall for Trinidad and Tobago remain unclear with large uncertainties. Model consensus among 21 GCM models project annual rainfall decrease in the range of 15% for Trinidad and
Tobago by the 2080's, however 3-4 of these models projected increase in annual rainfall. If the over drying trend projections are realized then it is likely that there will be intensification of dry spells and droughts in the vicinity
of Trinidad and Tobago towards the 2080's.
Results from HadCM3 model downscaled for the A2 and B2 emission scenarios using the Statistical Downscale Modeling (SDSM) also project increases in the early rainy season (June – August) rainfall in Trinidad and Tobago compared to
decreases in other countries in the region apart from Barbados. The drying trend projected in annual rainfall towards the 2080's is linked to a consensus in the models showing a shift to a more positive phase of the North Atlantic
Oscillation (NAO) and El Nino like pattern in the Pacific with higher temperatures.
Based on the projections local water resources can be expected to be impacted. Increase intense rainfall events over shorter periods will result in lower surface water quality, reduction in the recharge of ground water as run off would
be at a maximum; while Increase in longer dry spells and drought events coupled with warmer temperatures would increase agricultural irrigation demands,affect crop scheduling, increase heat related health impacts, coral bleaching and
saline intrusion.
Recent modelling of the current and future water resource availability on several small islands in the Caribbean including Trinidad and Tobago, using a macro-scale hydrological model and the SRES scenarios (Arnell, 2004),
found that many of these islands would be exposed to severe water stress under all SRES scenarios, and especially so under A2 and B25. Also, recent variations in sea level on the western Trinidad coast indicate that sea level in
the north is rising at a rate of about 1 mm/yr, while in the south the rate is about 4 mm/yr; the difference being a response to tectonic movements 6.
According to IPCC AR4 global Sea level is projected to rise between the present
(1980-1999) and the end of this century (2090-2099) by 0.35 m(0.23 to 0.47 m) for the A1B scenario. Based on research evidence published over most recently, mean global sea level rise is projected to increase above that of IPCC AR4
projections by the end of the century7 8 9 10. Furthermore, recent studies also suggest that because of the close proximity of the Caribbean including Trinidad and Tobago to the equator, sea level rise may be more outstanding than
some other regions.11
12 This suggests that, in the future, if projections materialize, coastal inundation, inland flooding, storm surge damage, and coastal erosion are likely to increase in the vicinity of Trinidad and Tobago,
however uncertainty remains high.
INTRODUCTION
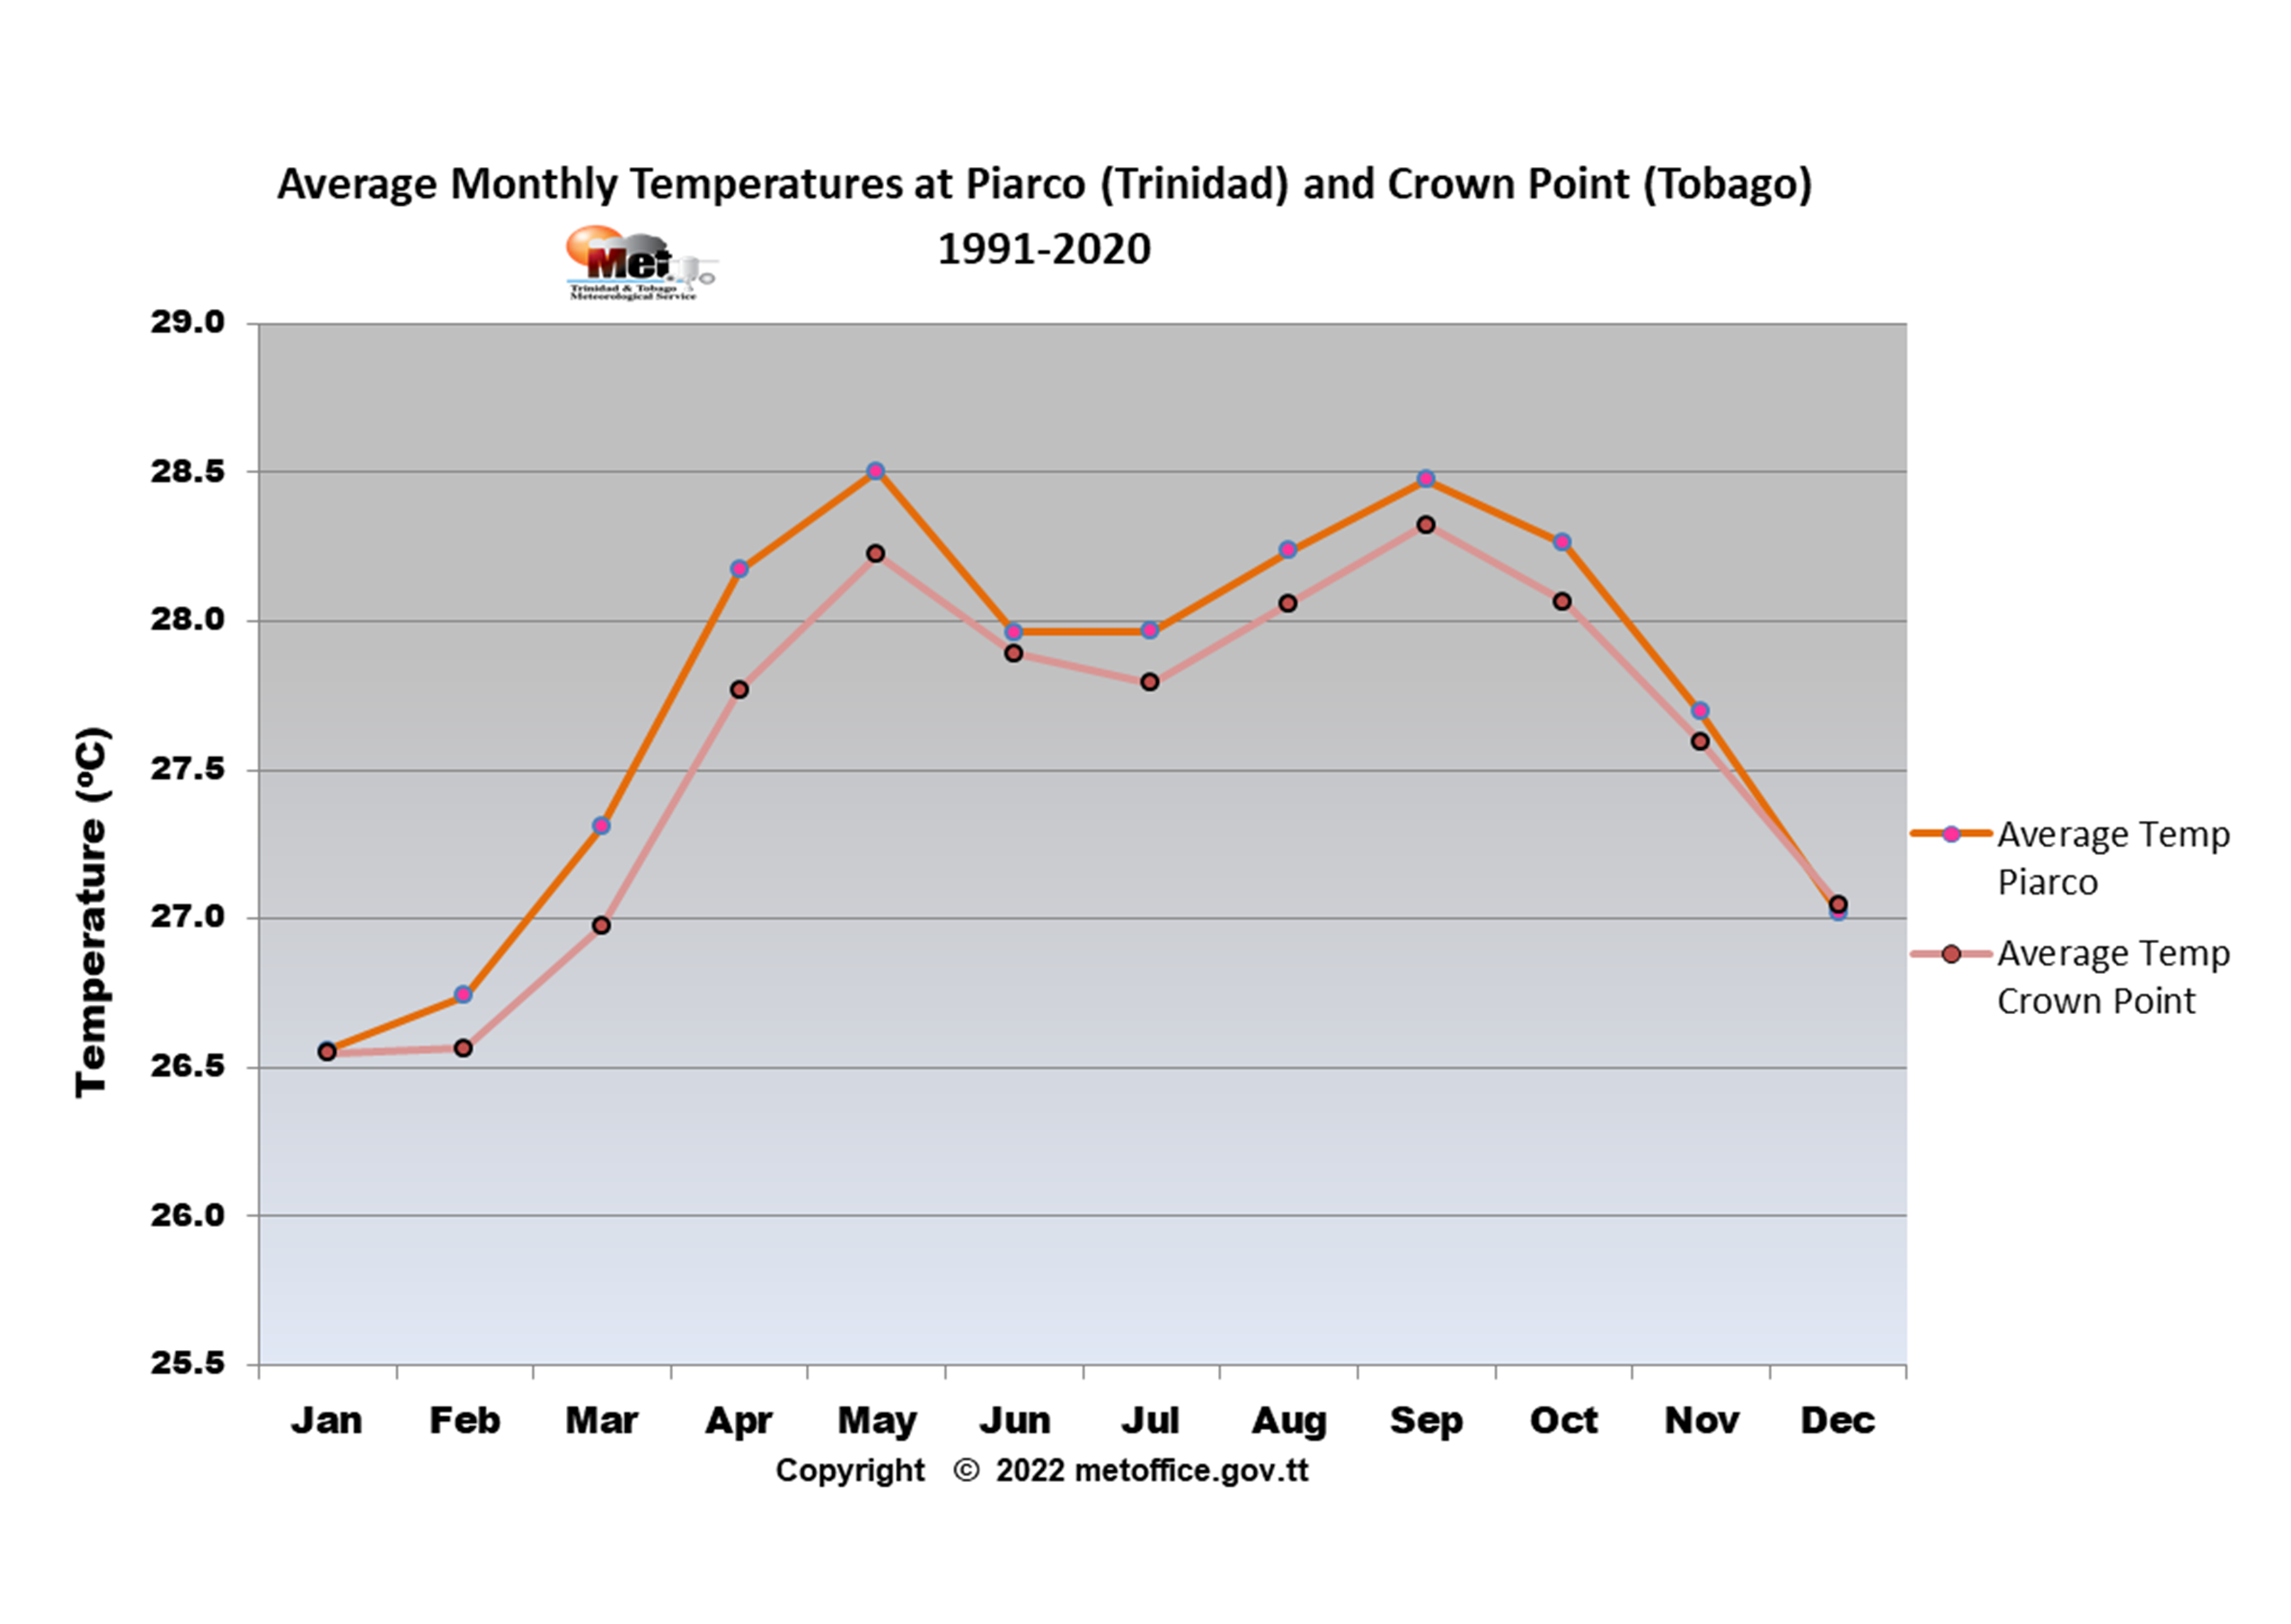
The national temperature, rainfall, sunshine and dust haze conditions for Trinidad and Tobago from 1946 to 2021 are shown on this page in graphical and tabular formats. The purpose of the graphs and tables is to highlight the long-term averages and extremes of Trinidad and Tobago climate record. The long-term average, known as the climatological normal, shows the latest set of 30-year averages, covering the period 1991-2020, for the reference climatological stations at Piarco, Trinidad and Crown Point, Tobago.
COPYRIGHT & CONTACT INFORMATION
Please note that the copyright for any data supplied by the Trinidad and Tobago Meteorological Service is held in the Republic of Trinidad and Tobago and the user shall give acknowledgement of the source in reference to the data, graphic and information. The users shall not reproduce (electronically or otherwise), modify or supply these graphic, data, or information as if it were their own.
AVERAGES
These graphs show the average annual, seasonal and monthly temperature, rainfall distribution, extreme values and ranking across Trinidad and Tobago. These values can be used to provide an estimate of what is most likely to happen. The averages for various annual, seasonal and monthly time periods are calculated over the period 1991 to 2020.
TEMPERATURE CLIMATOLOGY
At the national climate reference stations located at Piarco, Trinidad and Crown Point, Tobago, for the climate reference period 1991-2020, May and September are the warmest months in terms of daily average temperatures. February is the coolest month. At Piarco for the climate reference period 1991-2020, in terms of daily maximum average temperatures, September is the warmest month, with an average maximum temperature of 33.0°C, followed by April with an average maximum temperature of 32.8°C. The months of May and June share average minimum night temperatures of 24.3°C and have the warmest nights on average.
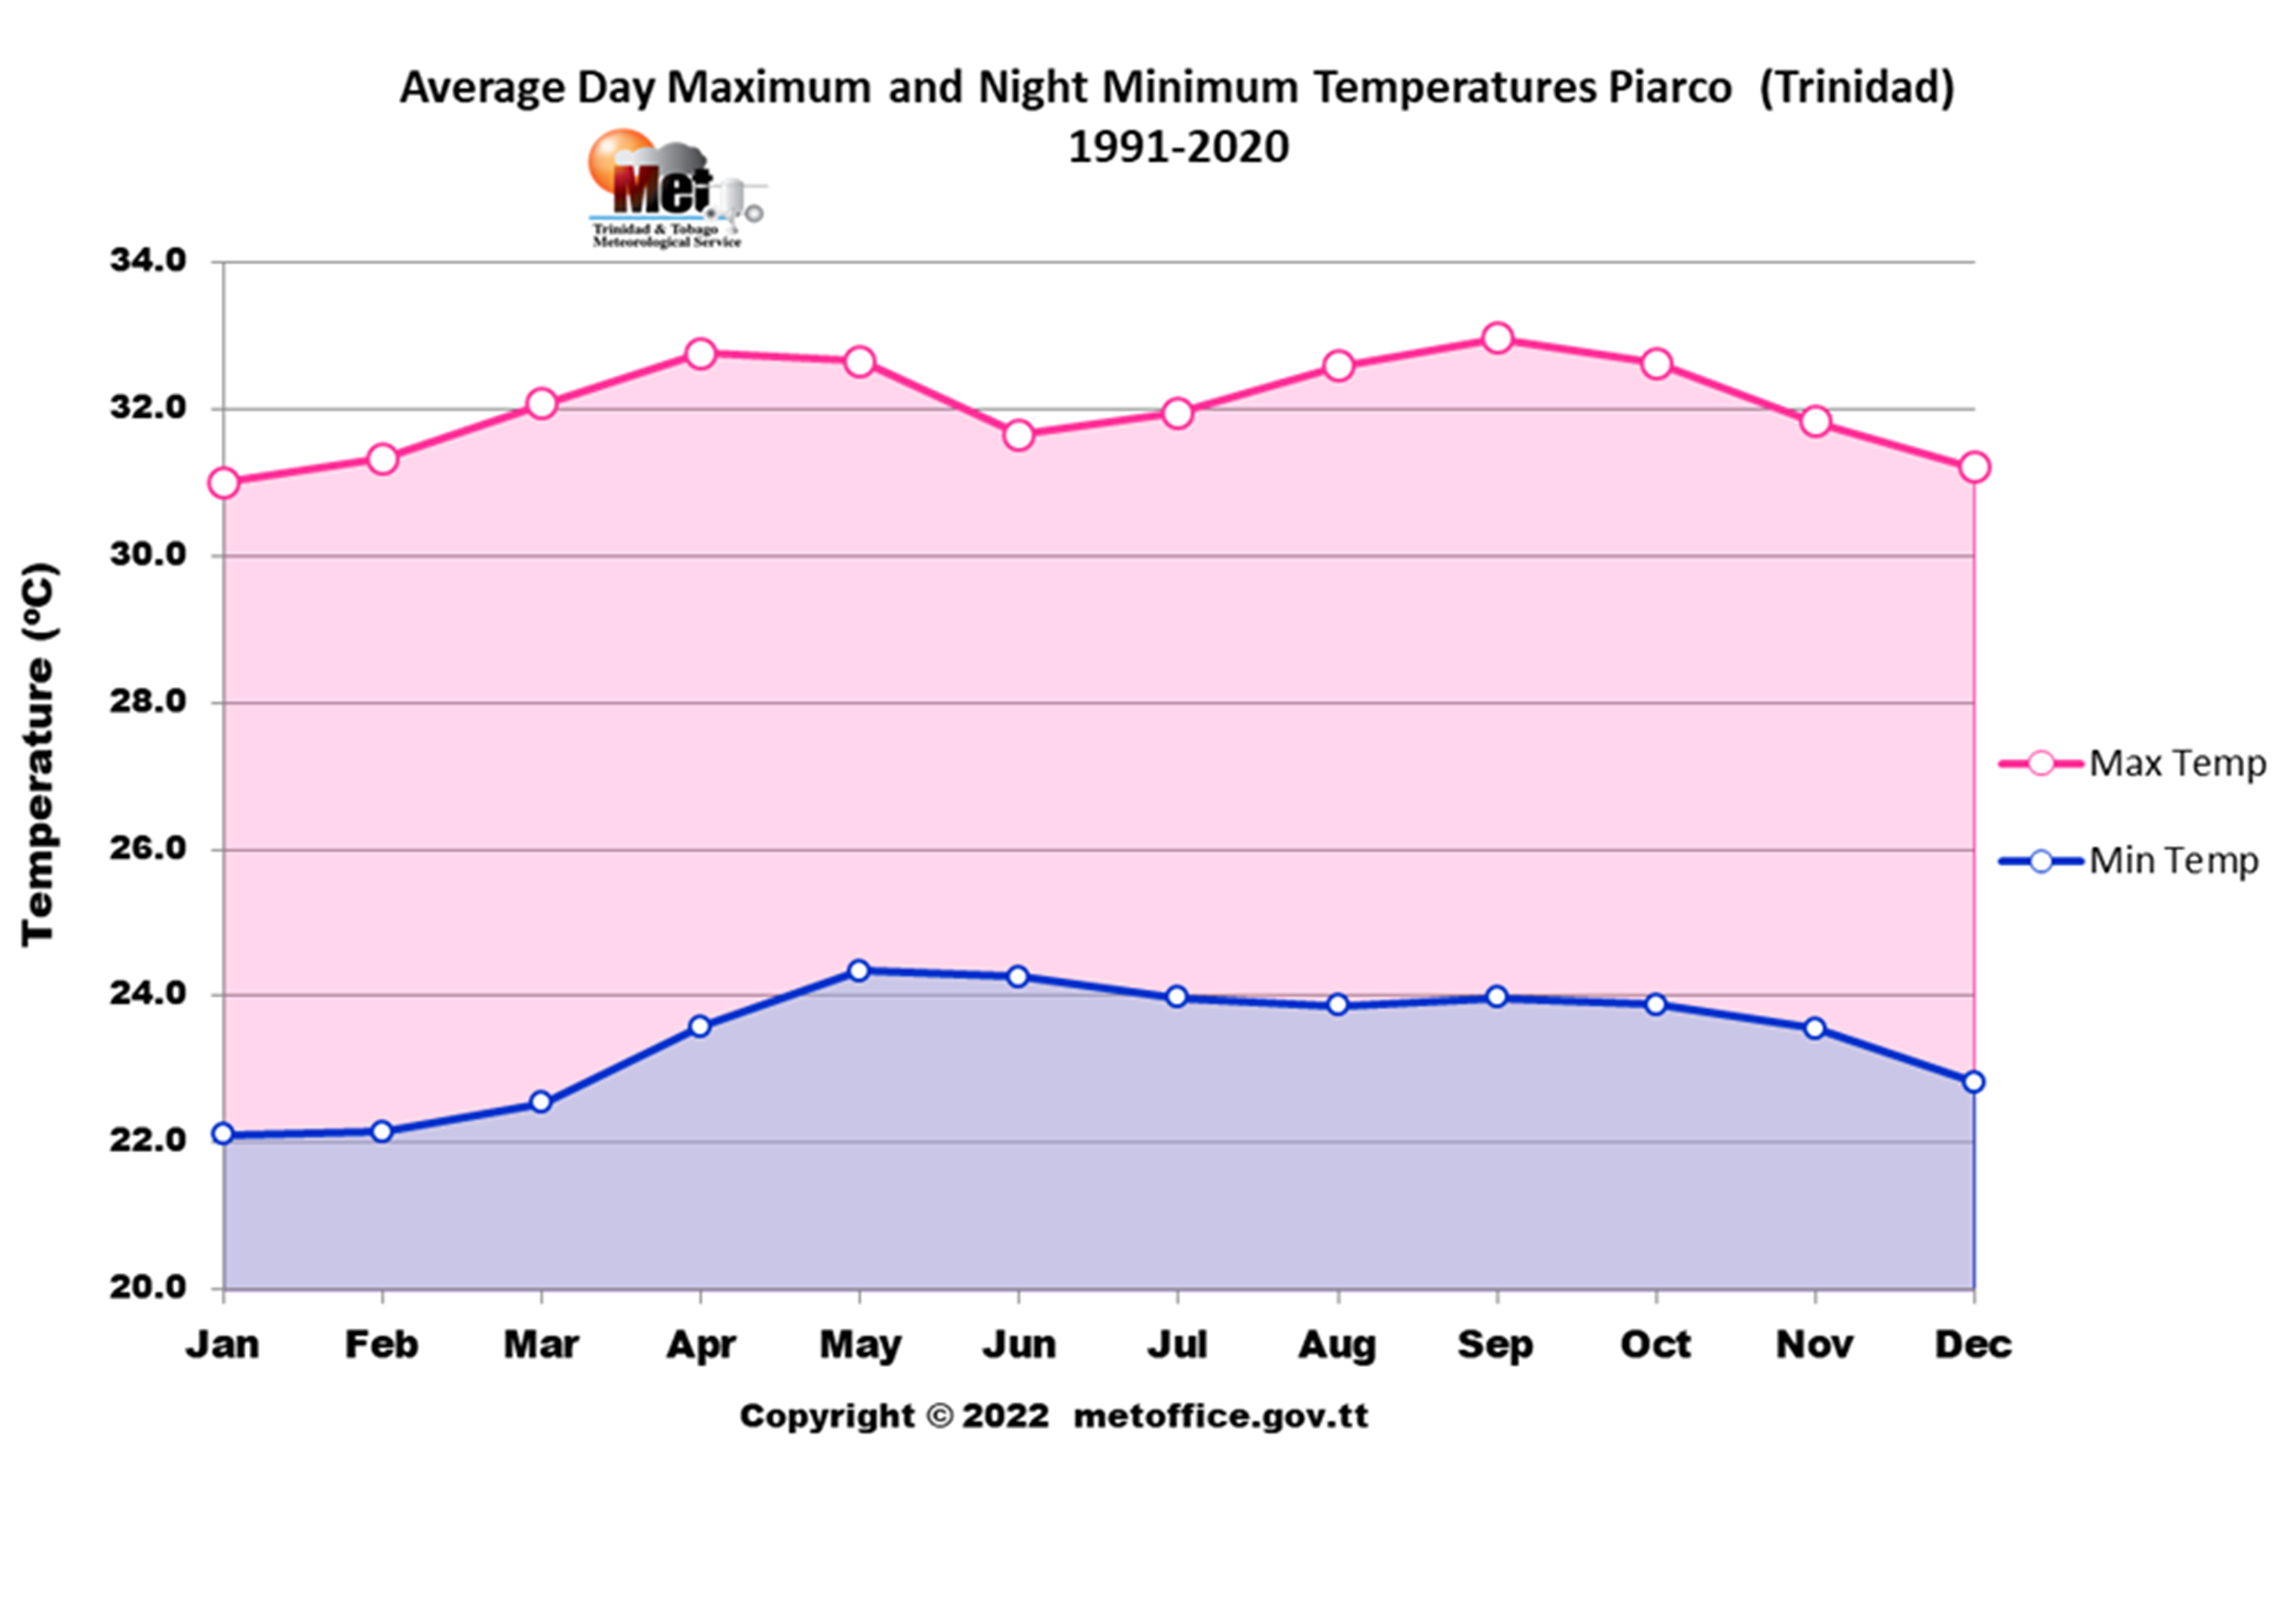
MONTHLY TEMPERATURE PATTERNS
Long-term average monthly day-maximum and night-minimum temperatures show the seasonal variations in Trinidad and Tobago's climate. These patterns help understand the temperature extremes and daily temperature ranges throughout the year.
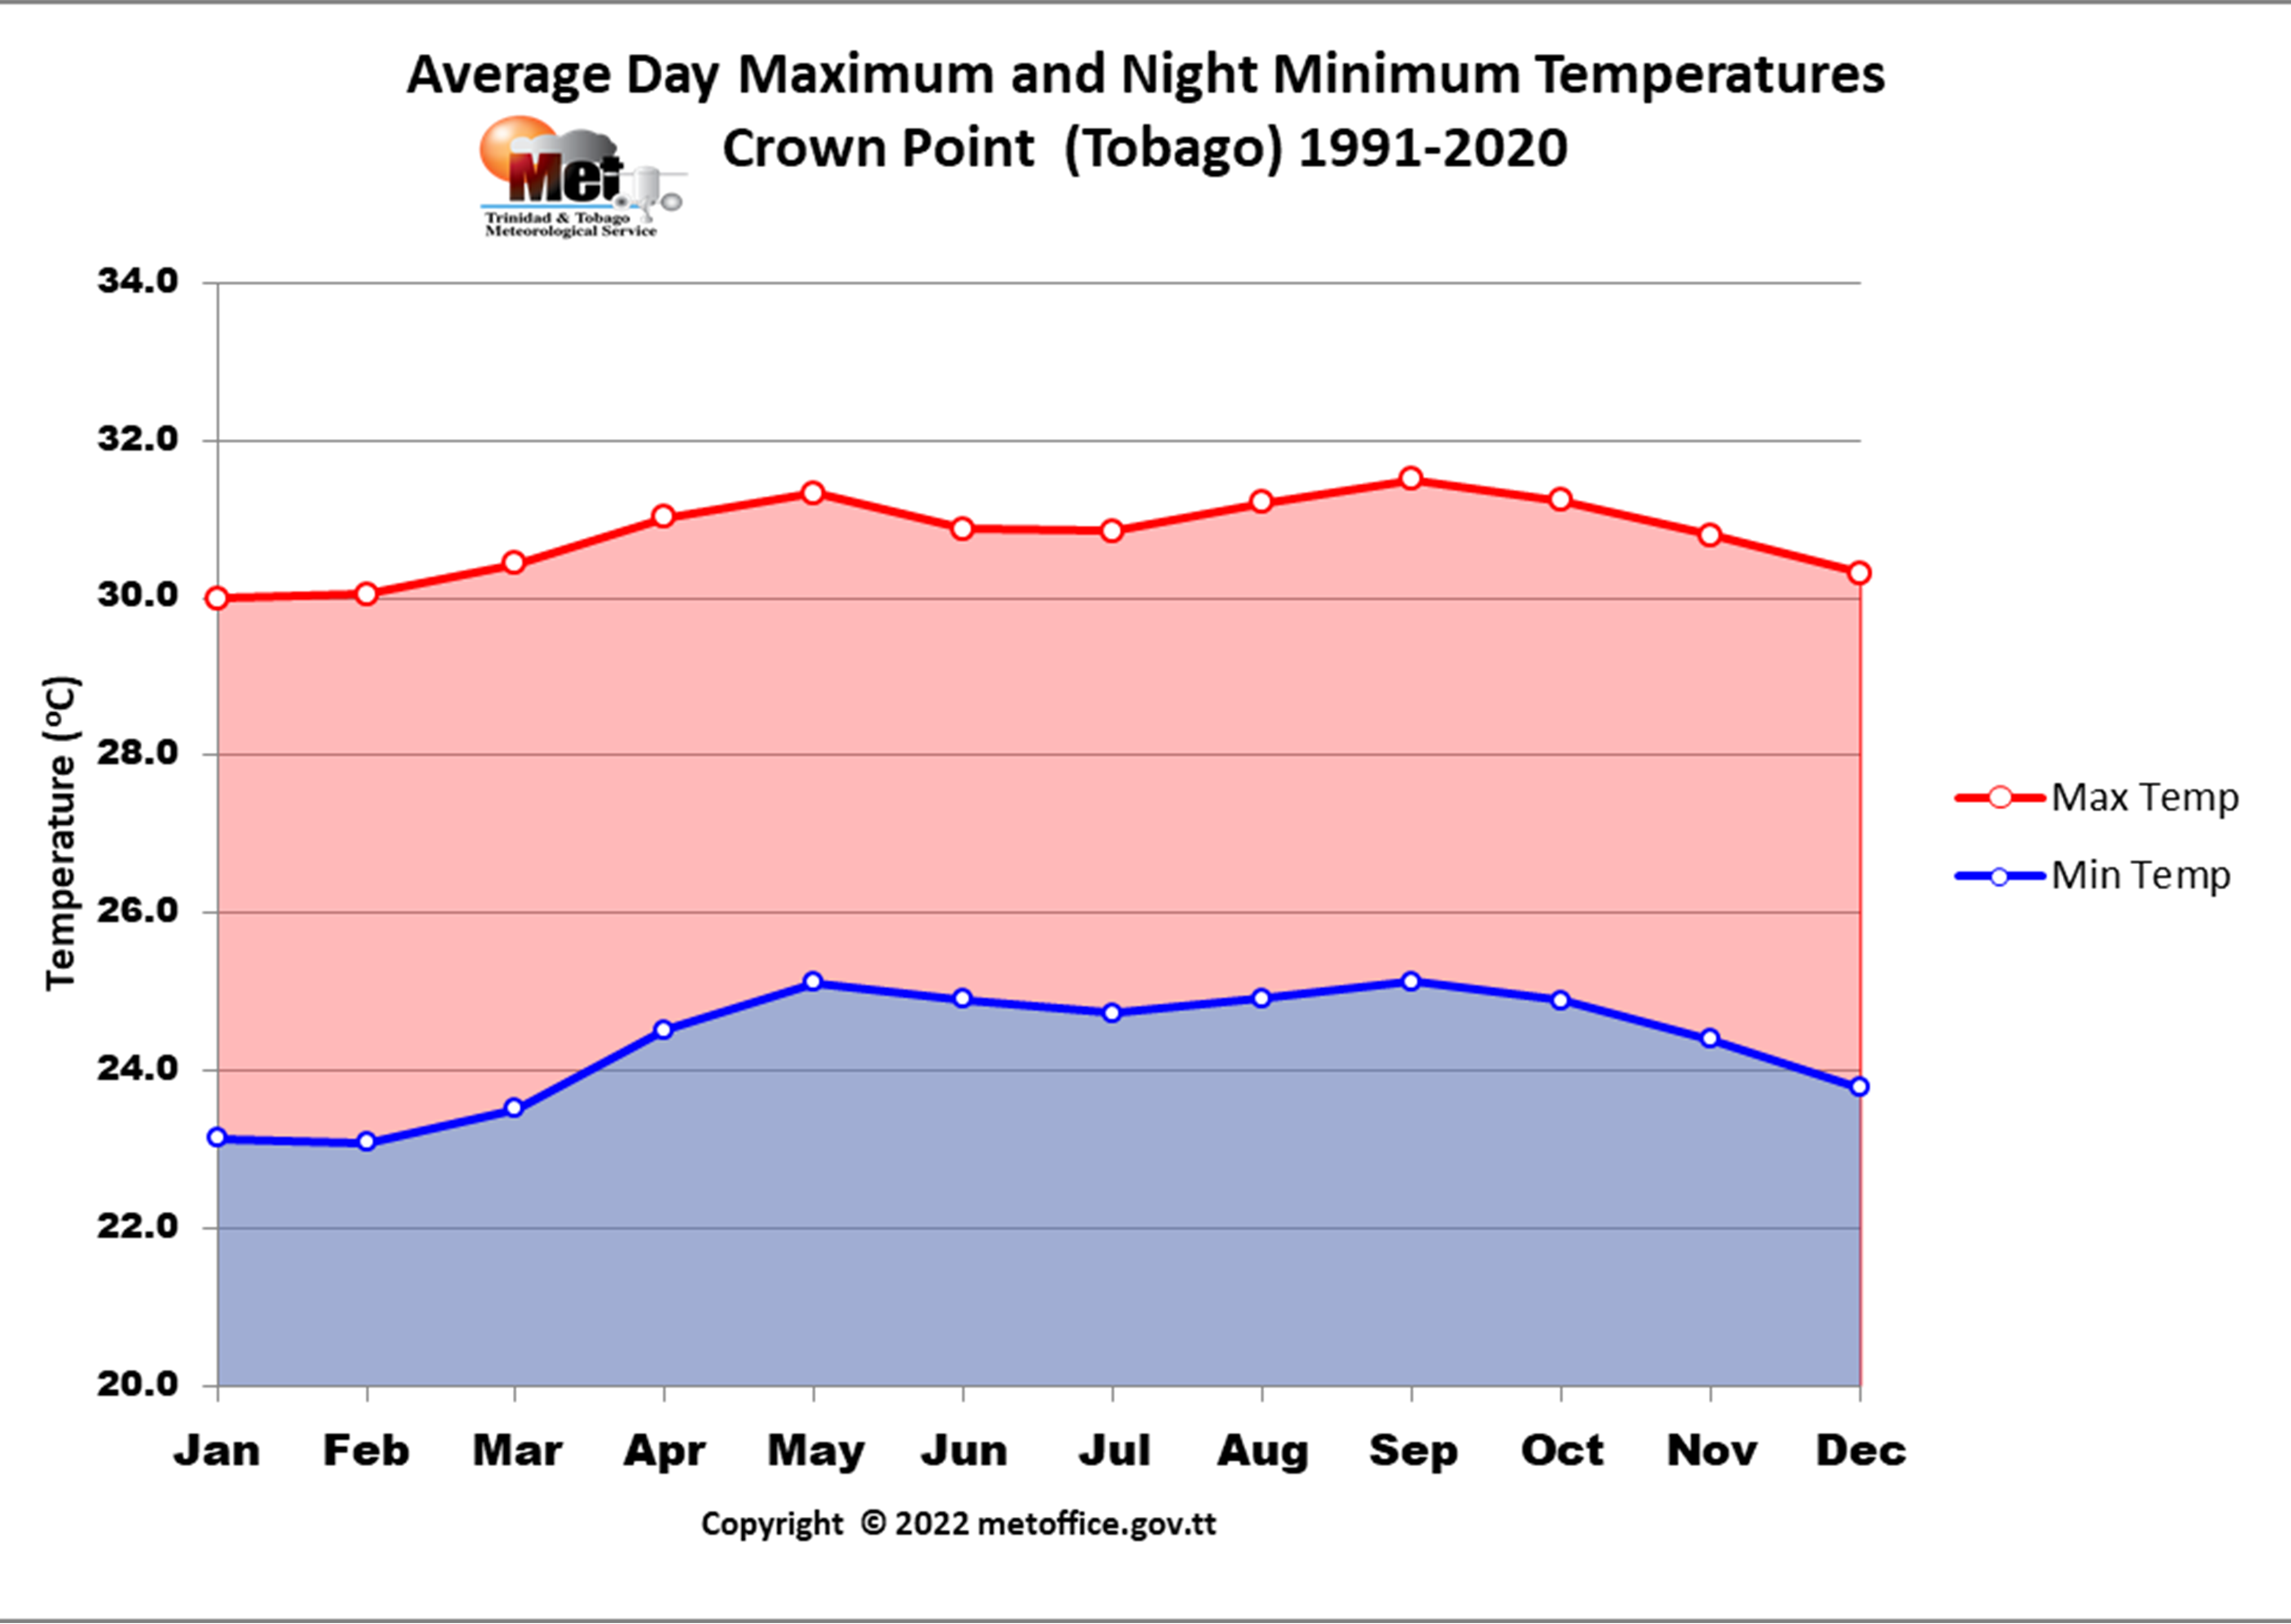
CROWN POINT TEMPERATURE PATTERNS
At Crown Point (1991–2020), September is the warmest month with an average maximum temperature of 31.5°C, followed by May at 31.3°C. May and September also have the warmest nights, with an average minimum temperature of 25.1°C.
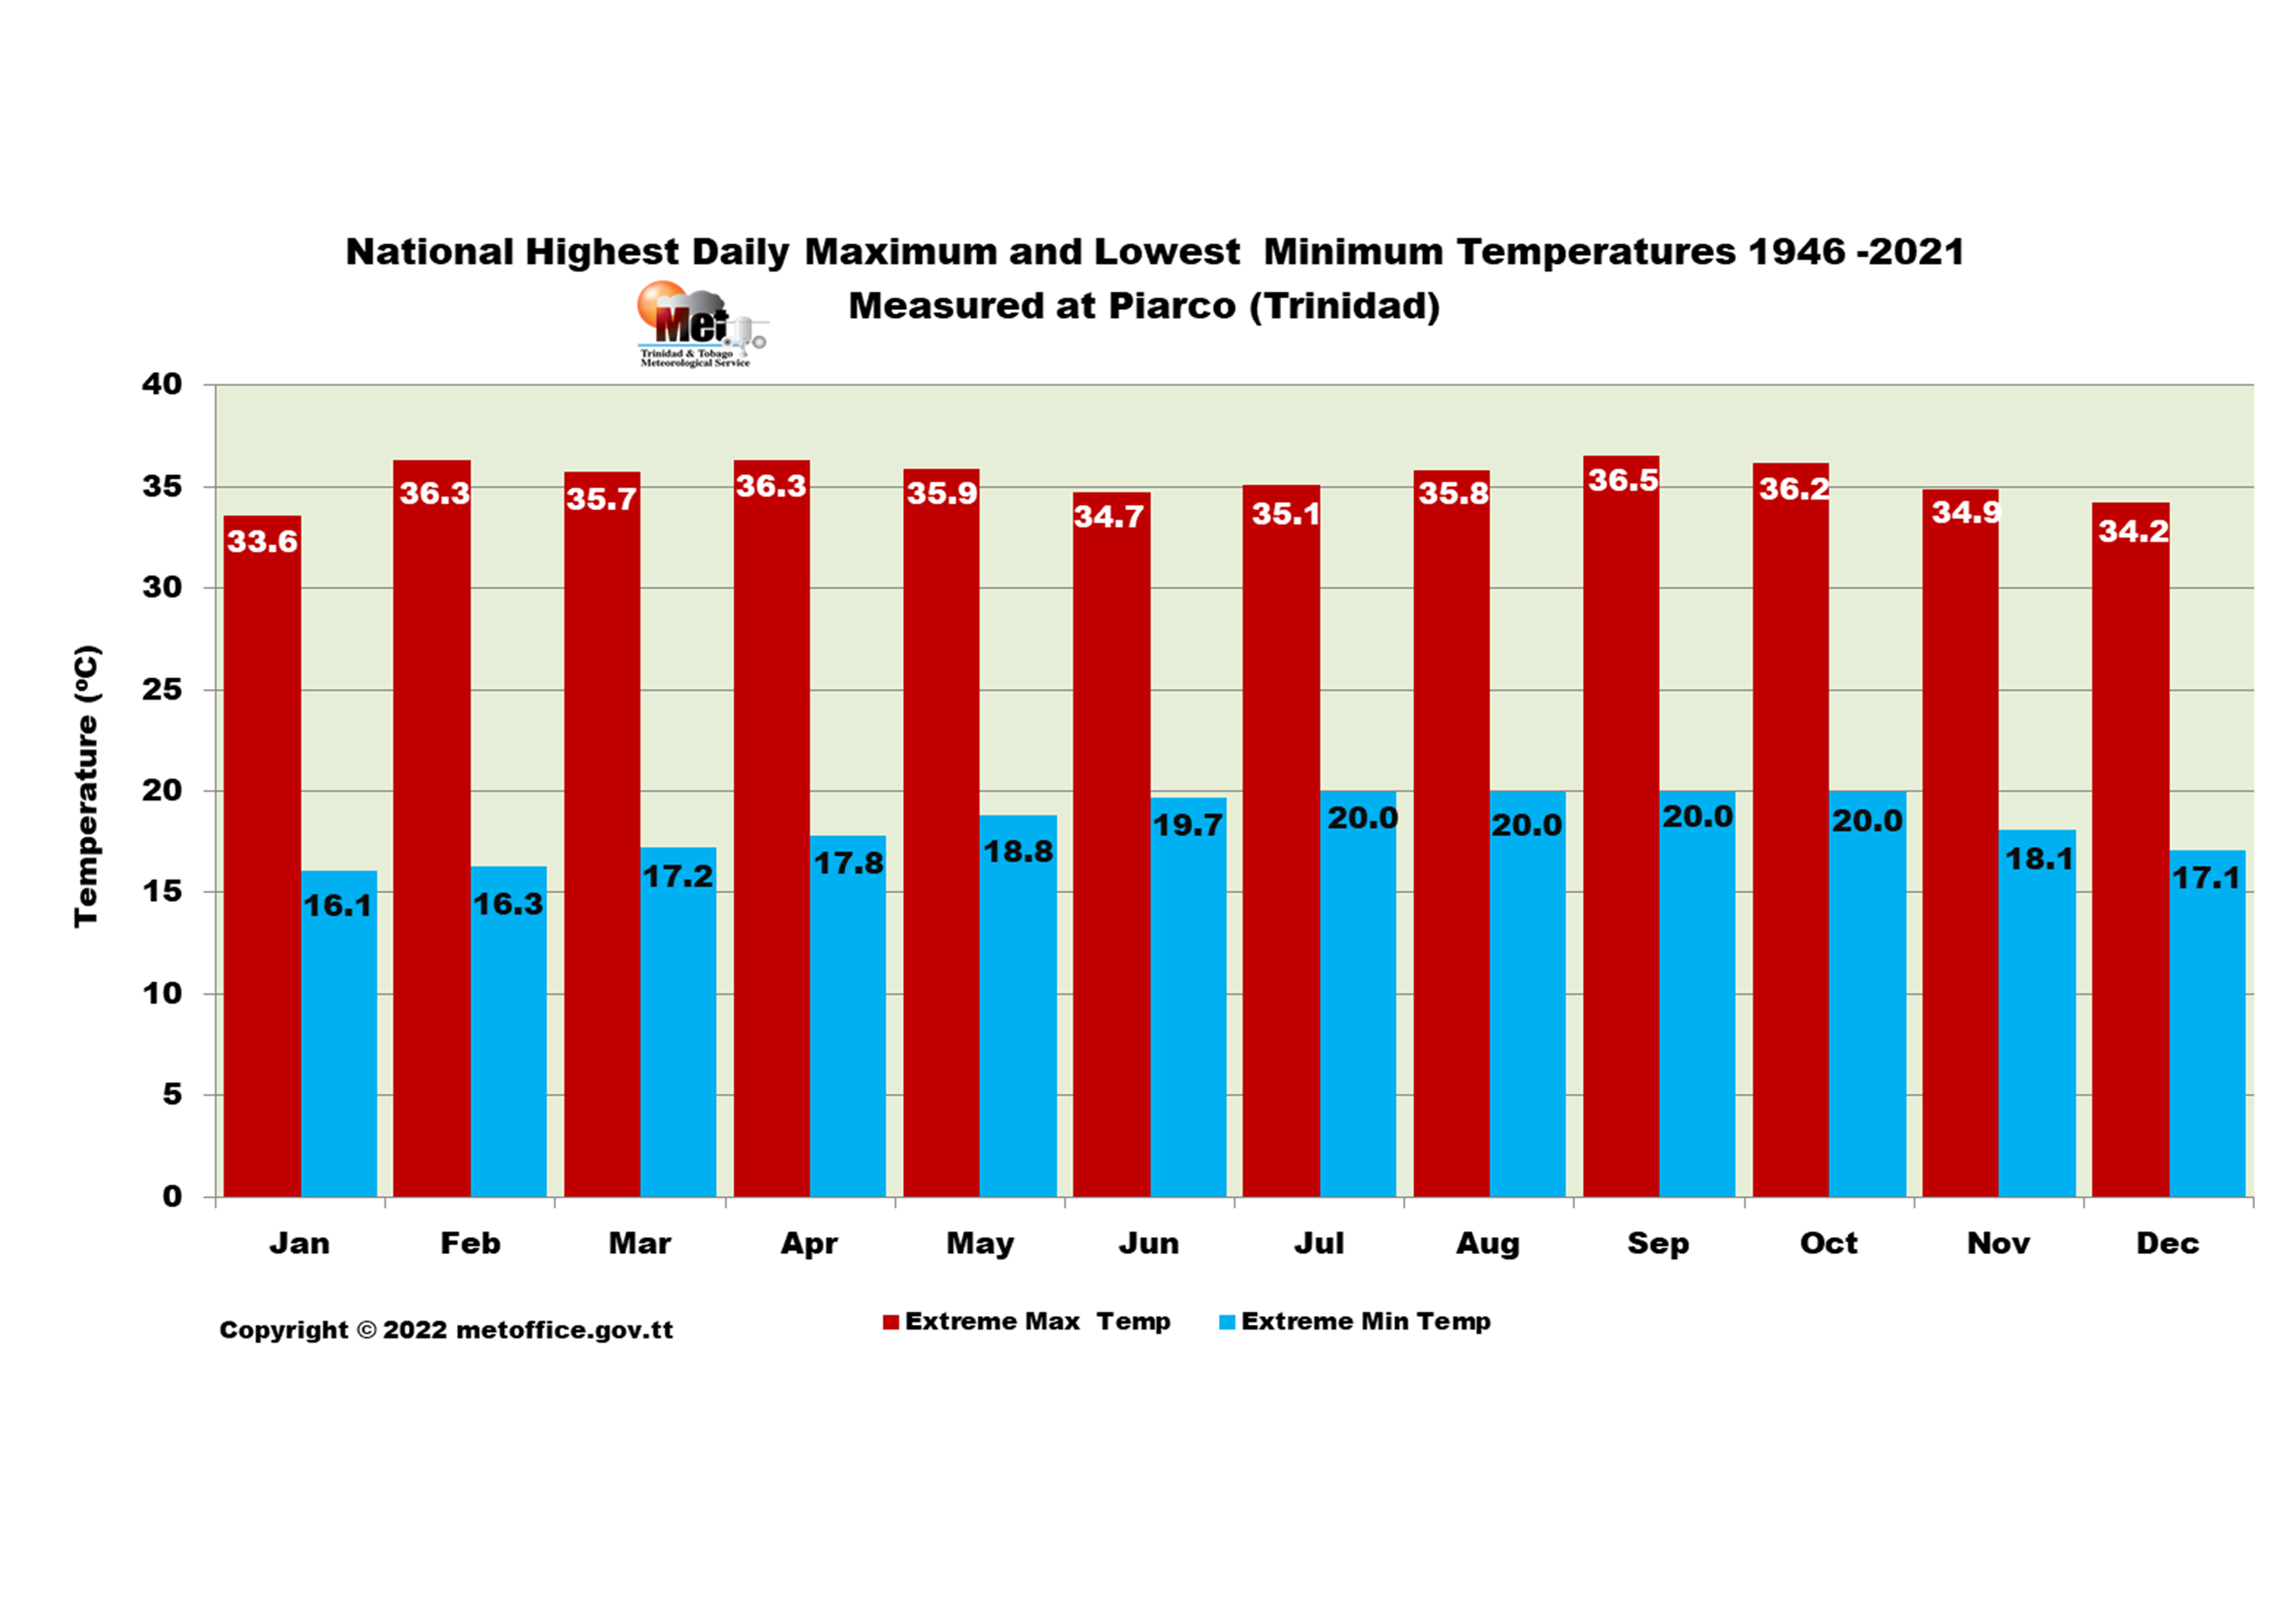
EXTREME TEMPERATURE RECORDS
Measured at Piarco from 1959 to 2021. The warmest maximum daily temperature recorded nationally is 36.5°C, which occurred on September 25th, 1990 at Piarco. The coolest minimum temperature is 16.1°C, which occurred on January 21st and 30th, 1964 at Piarco.
HIGHEST AND LOWEST EXTREME DAILY MAXIMUM AND MINIMUM TEMPERATURES(°C)
| Month | Jan | Feb | Mar | Apr | May | Jun | Jul | Aug | Sep | Oct | Nov | Nov |
|---|---|---|---|---|---|---|---|---|---|---|---|---|
| Max Temp | 33.6 | 36.3 | 35.7 | 36.3 | 35.9 | 34.7 | 35.1 | 35.8 | 36.5 | 36.2 | 34.9 | 34.2 |
| Date | 17/2012 | 25/2010 | 8/2010 | 16/2016 | 11/2010 | 22/2010 04/1999 | 29/1999 | 23/2017 | 25/1990 | 17/2016 19/2016 | 8/2008 | 21/2010 |
| Extreme Min Temp | 16.1 | 16.3 | 17.2 | 17.8 | 18.8 | 19.7 | 20 | 20 | 20 | 20 | 18.1 | 17.1 |
| Date | 21/1964 30/1964 | 24/1979 | 2/1962 | 15/1976 | 4/1967 | 23/1971 | 9/1961 | 7/1965 15/1965 | 2/1974 | 15/1976 | 17/1970 | 29/1975 |
HEAT SEASON PATTERNS
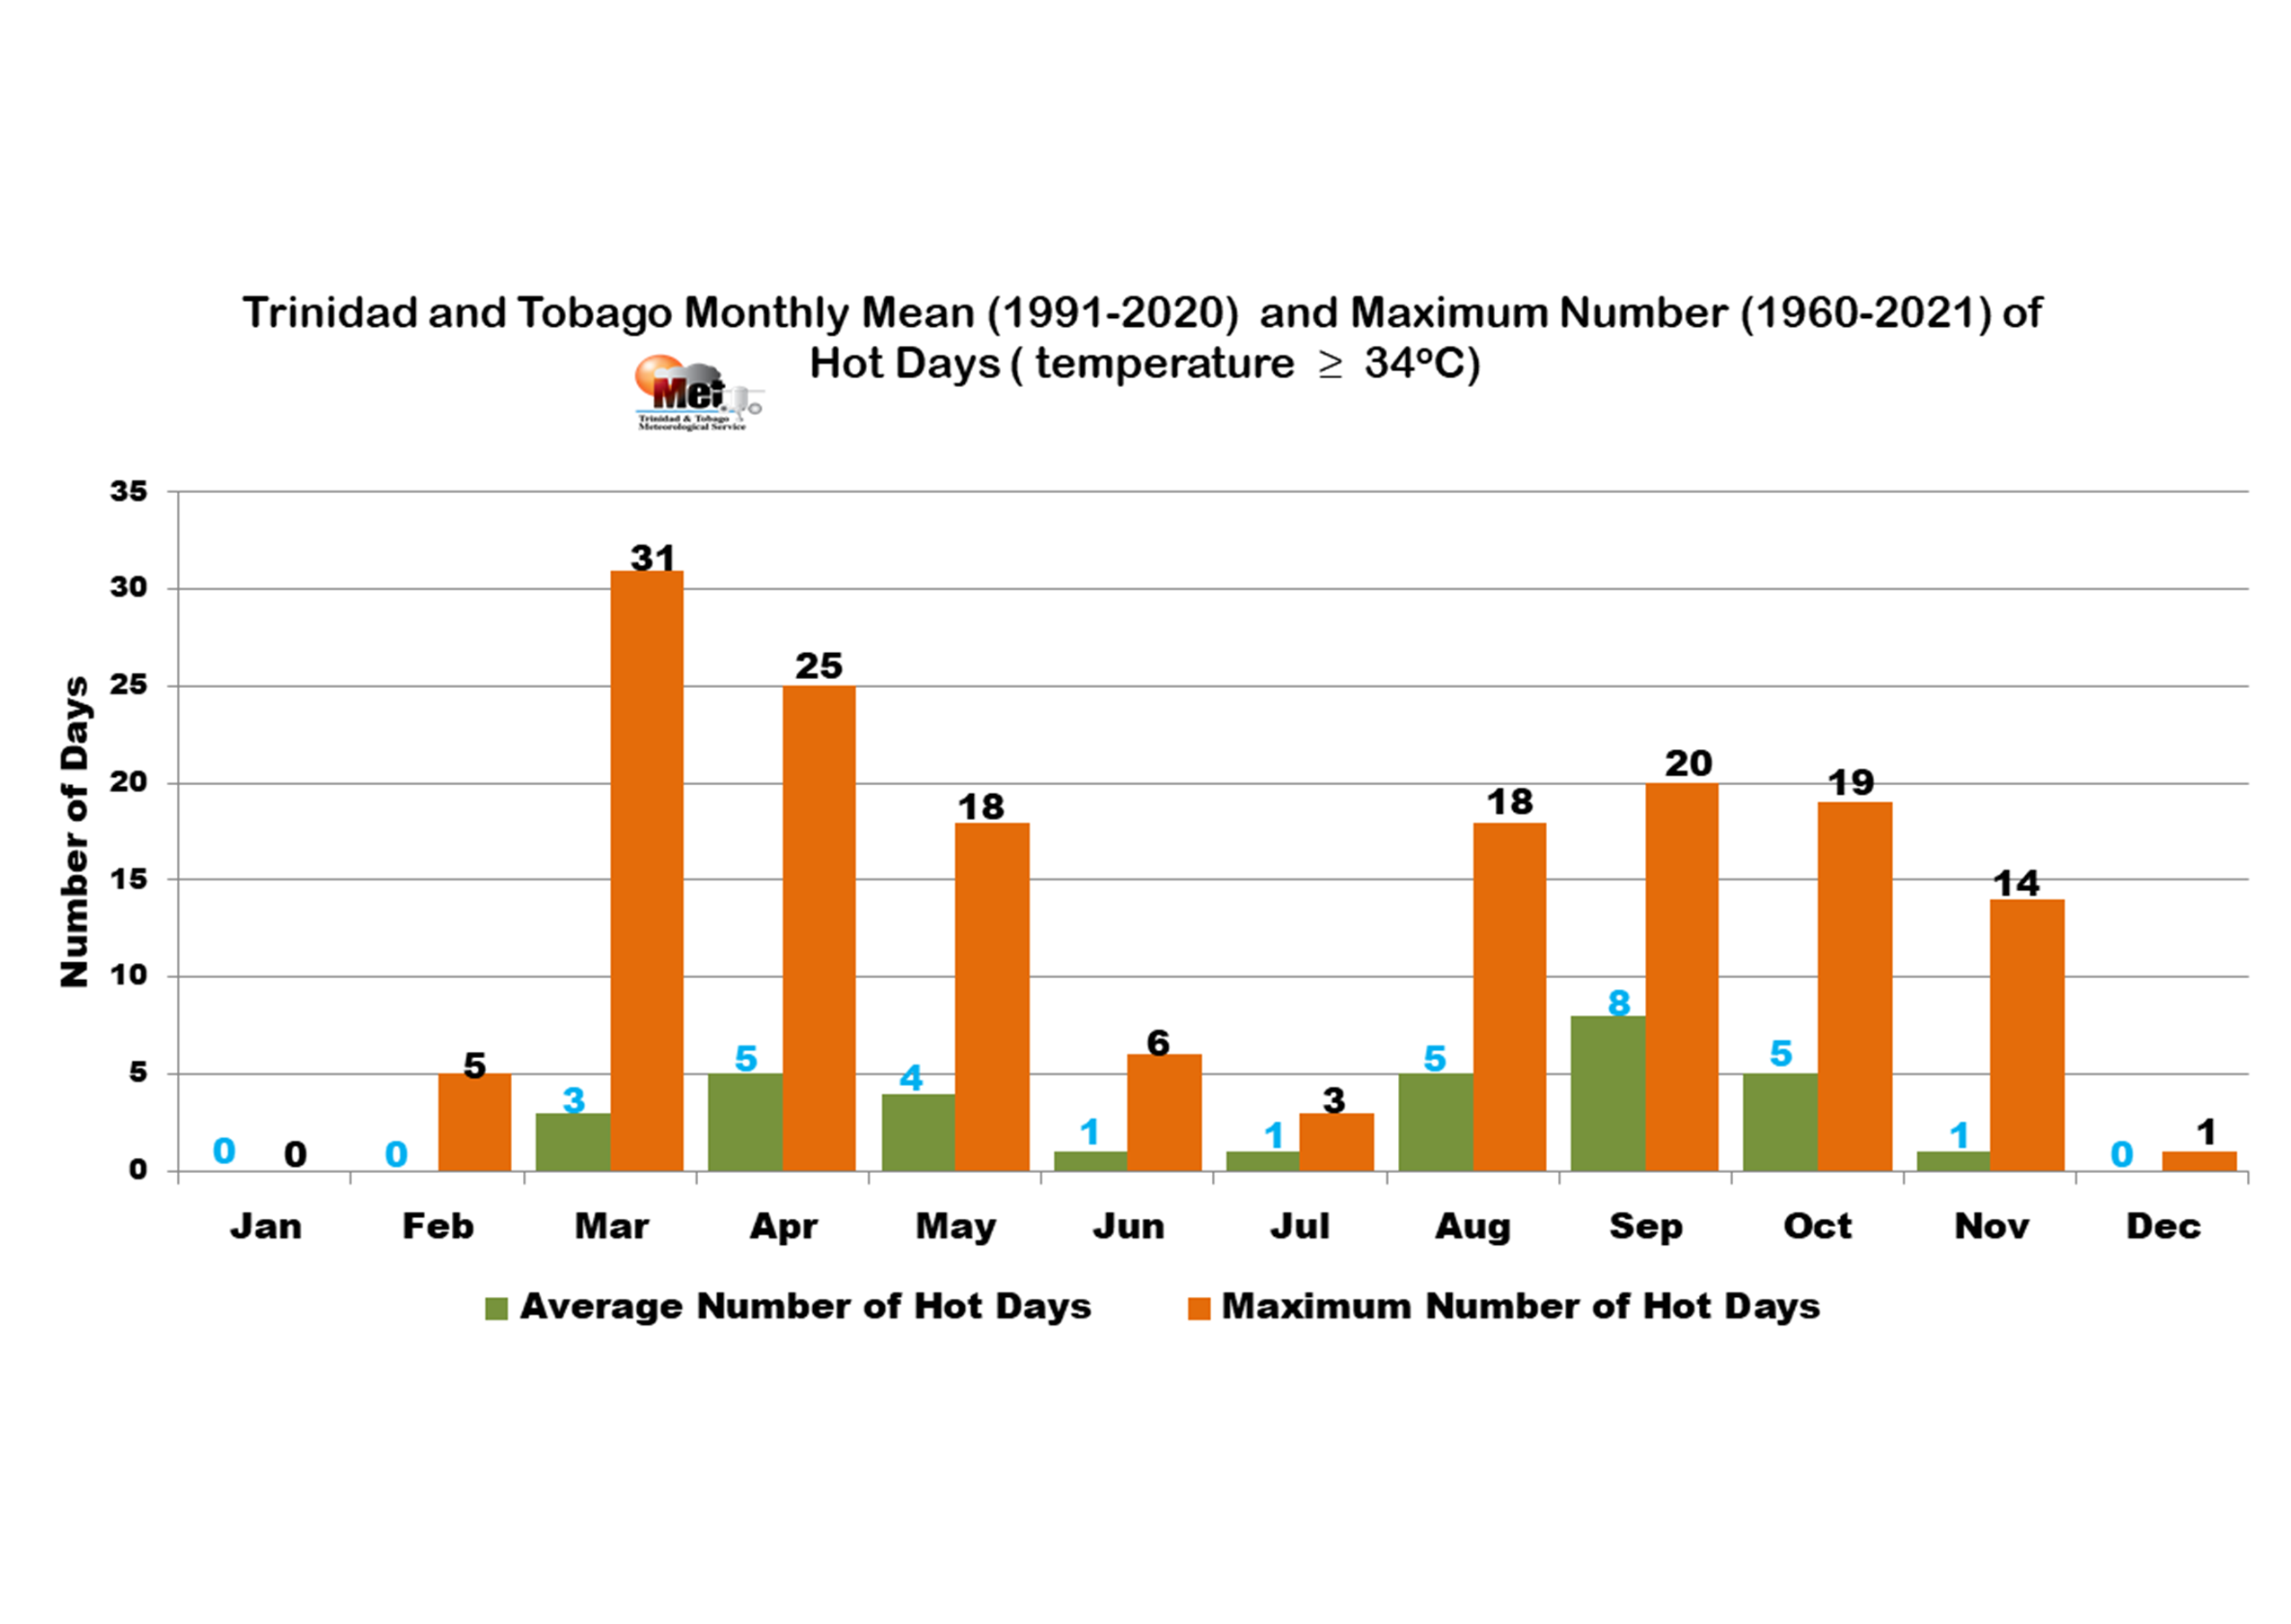
Trinidad and Tobago's heat season, marked by the highest frequency of hot days (≥34.0°C), lasts from March to October. The peak heat occurs in April–May and August–October.
SUNSHINE PATTERNS
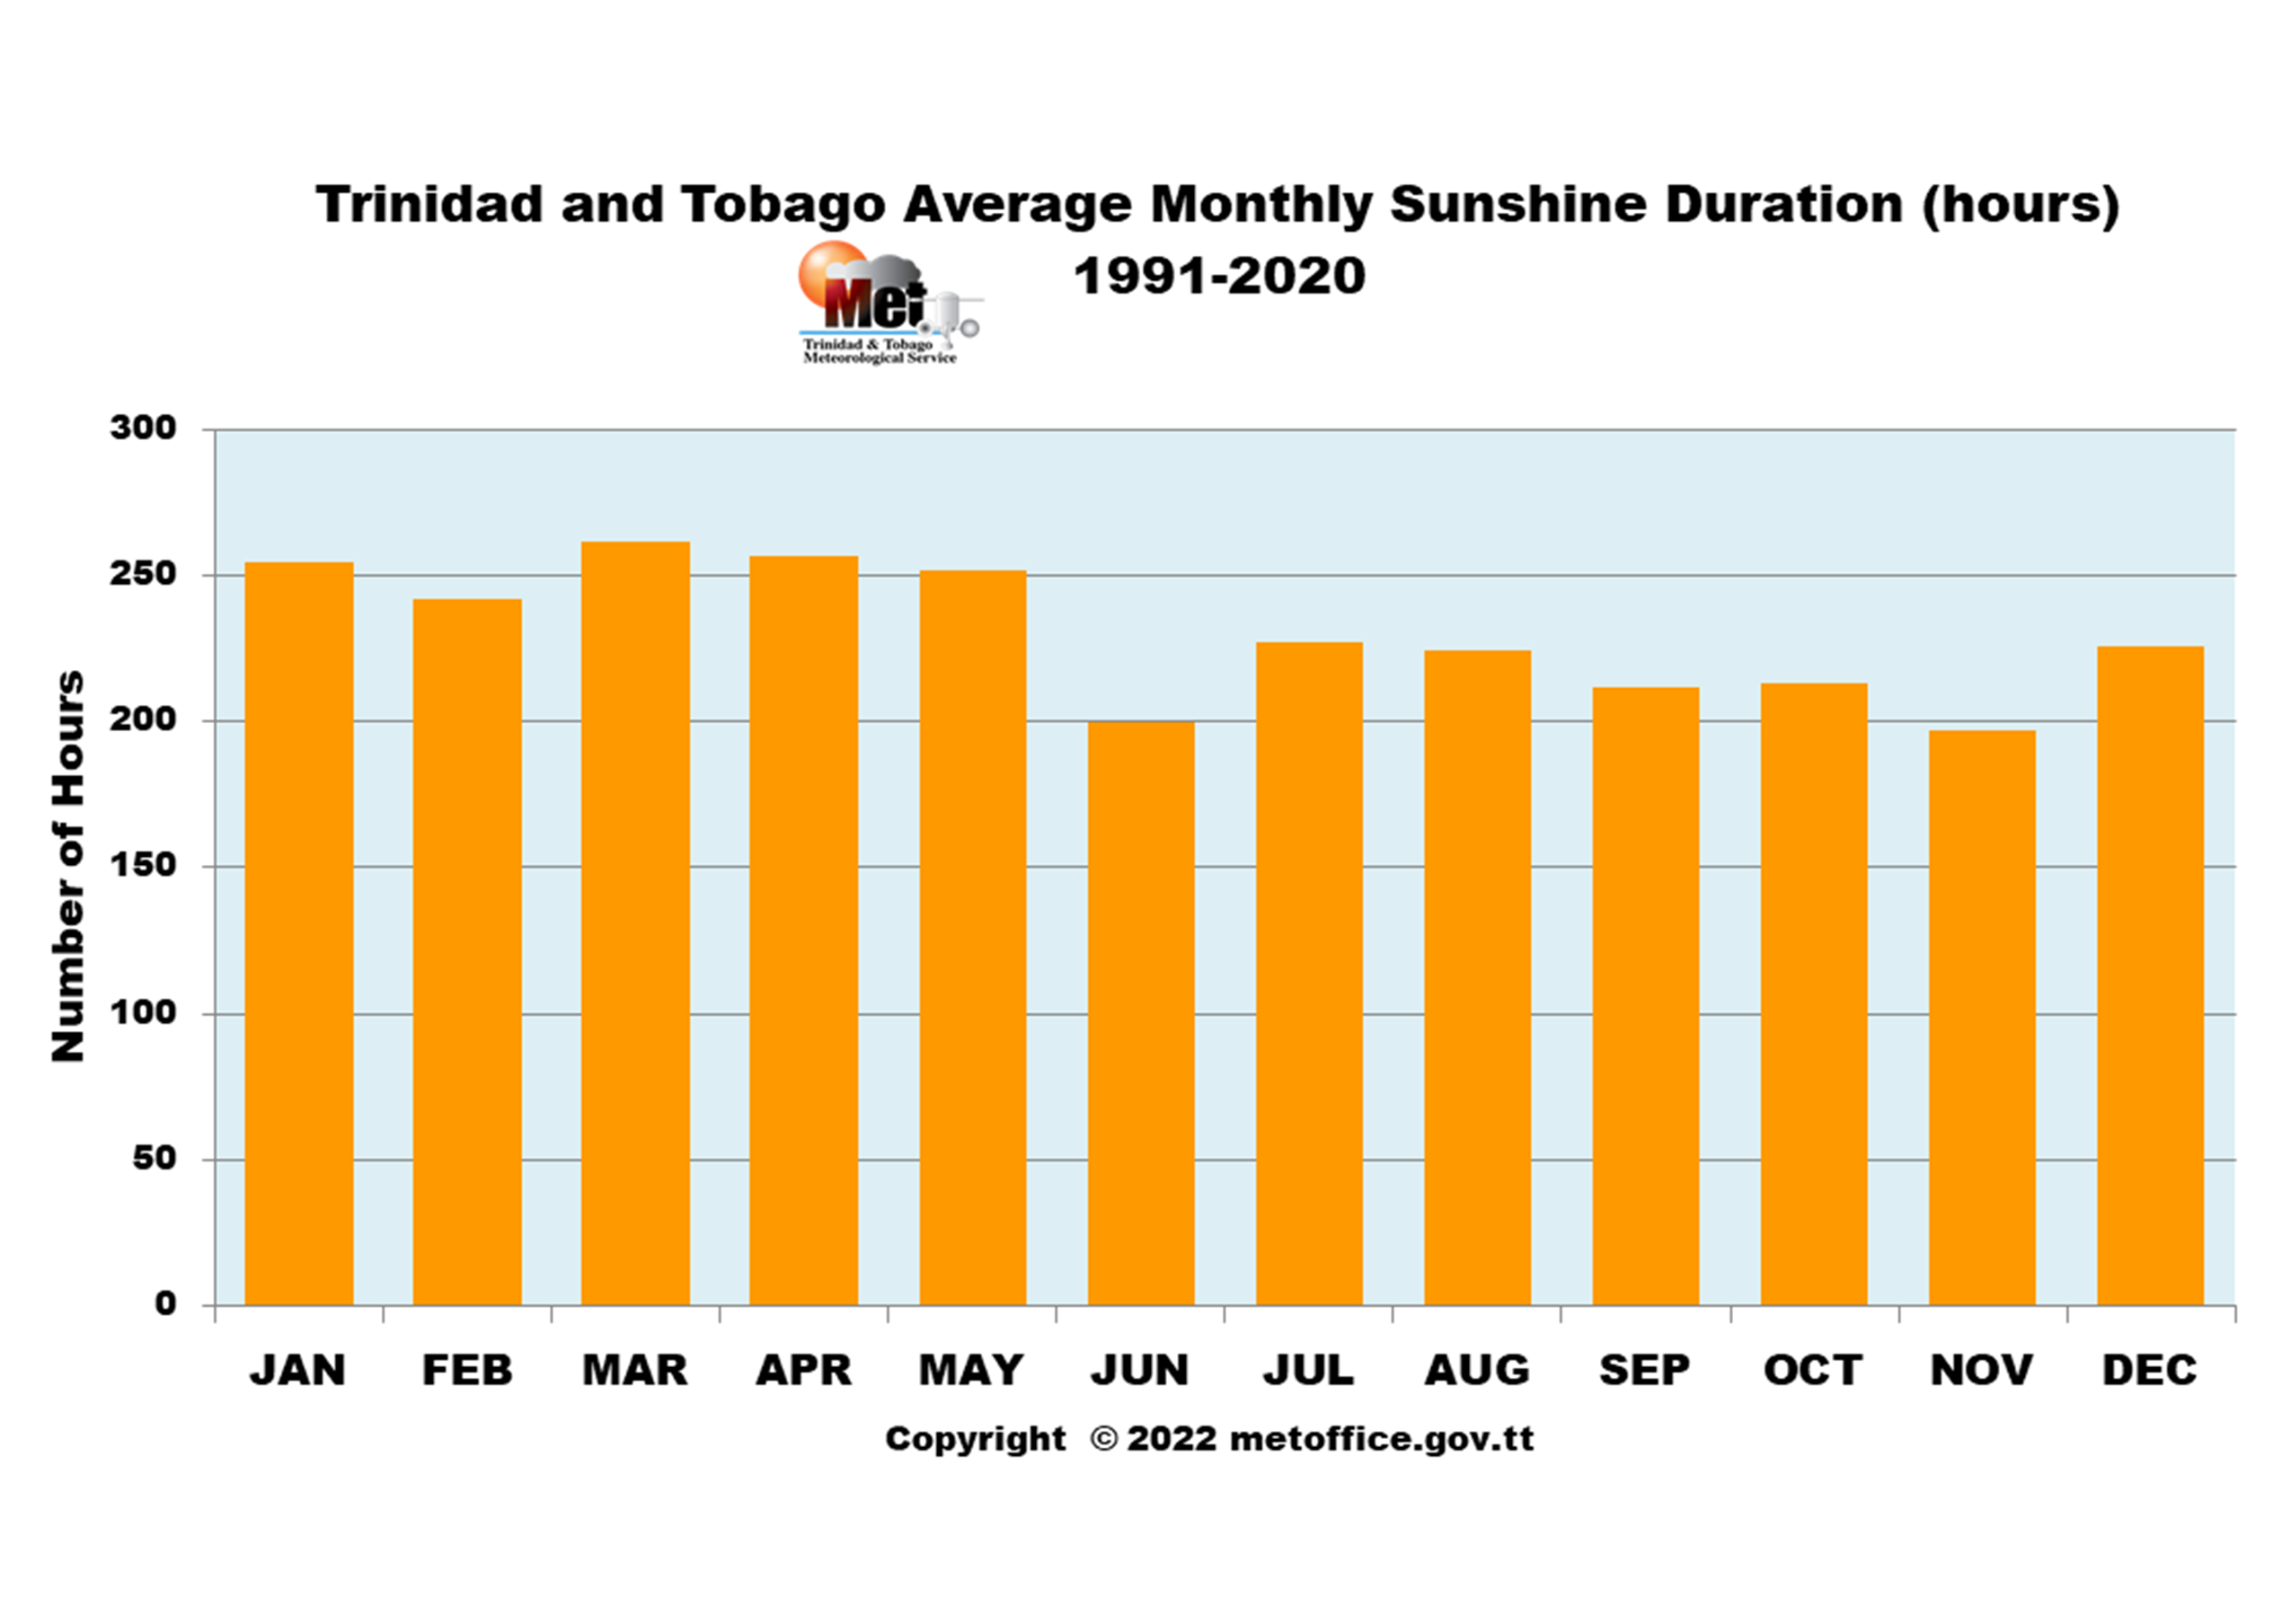
Trinidad and Tobago's average annual sunshine (1991–2020) is 2,766 hours. March is the sunniest month (261.5 hours), followed by April (256.6 hours), while November is the least sunny (197.2 hours). The sunniest month on record is March 2010 (319.5 hours), and the least sunny is June 1982 (104 hours).
TEMPERATURE TRENDS
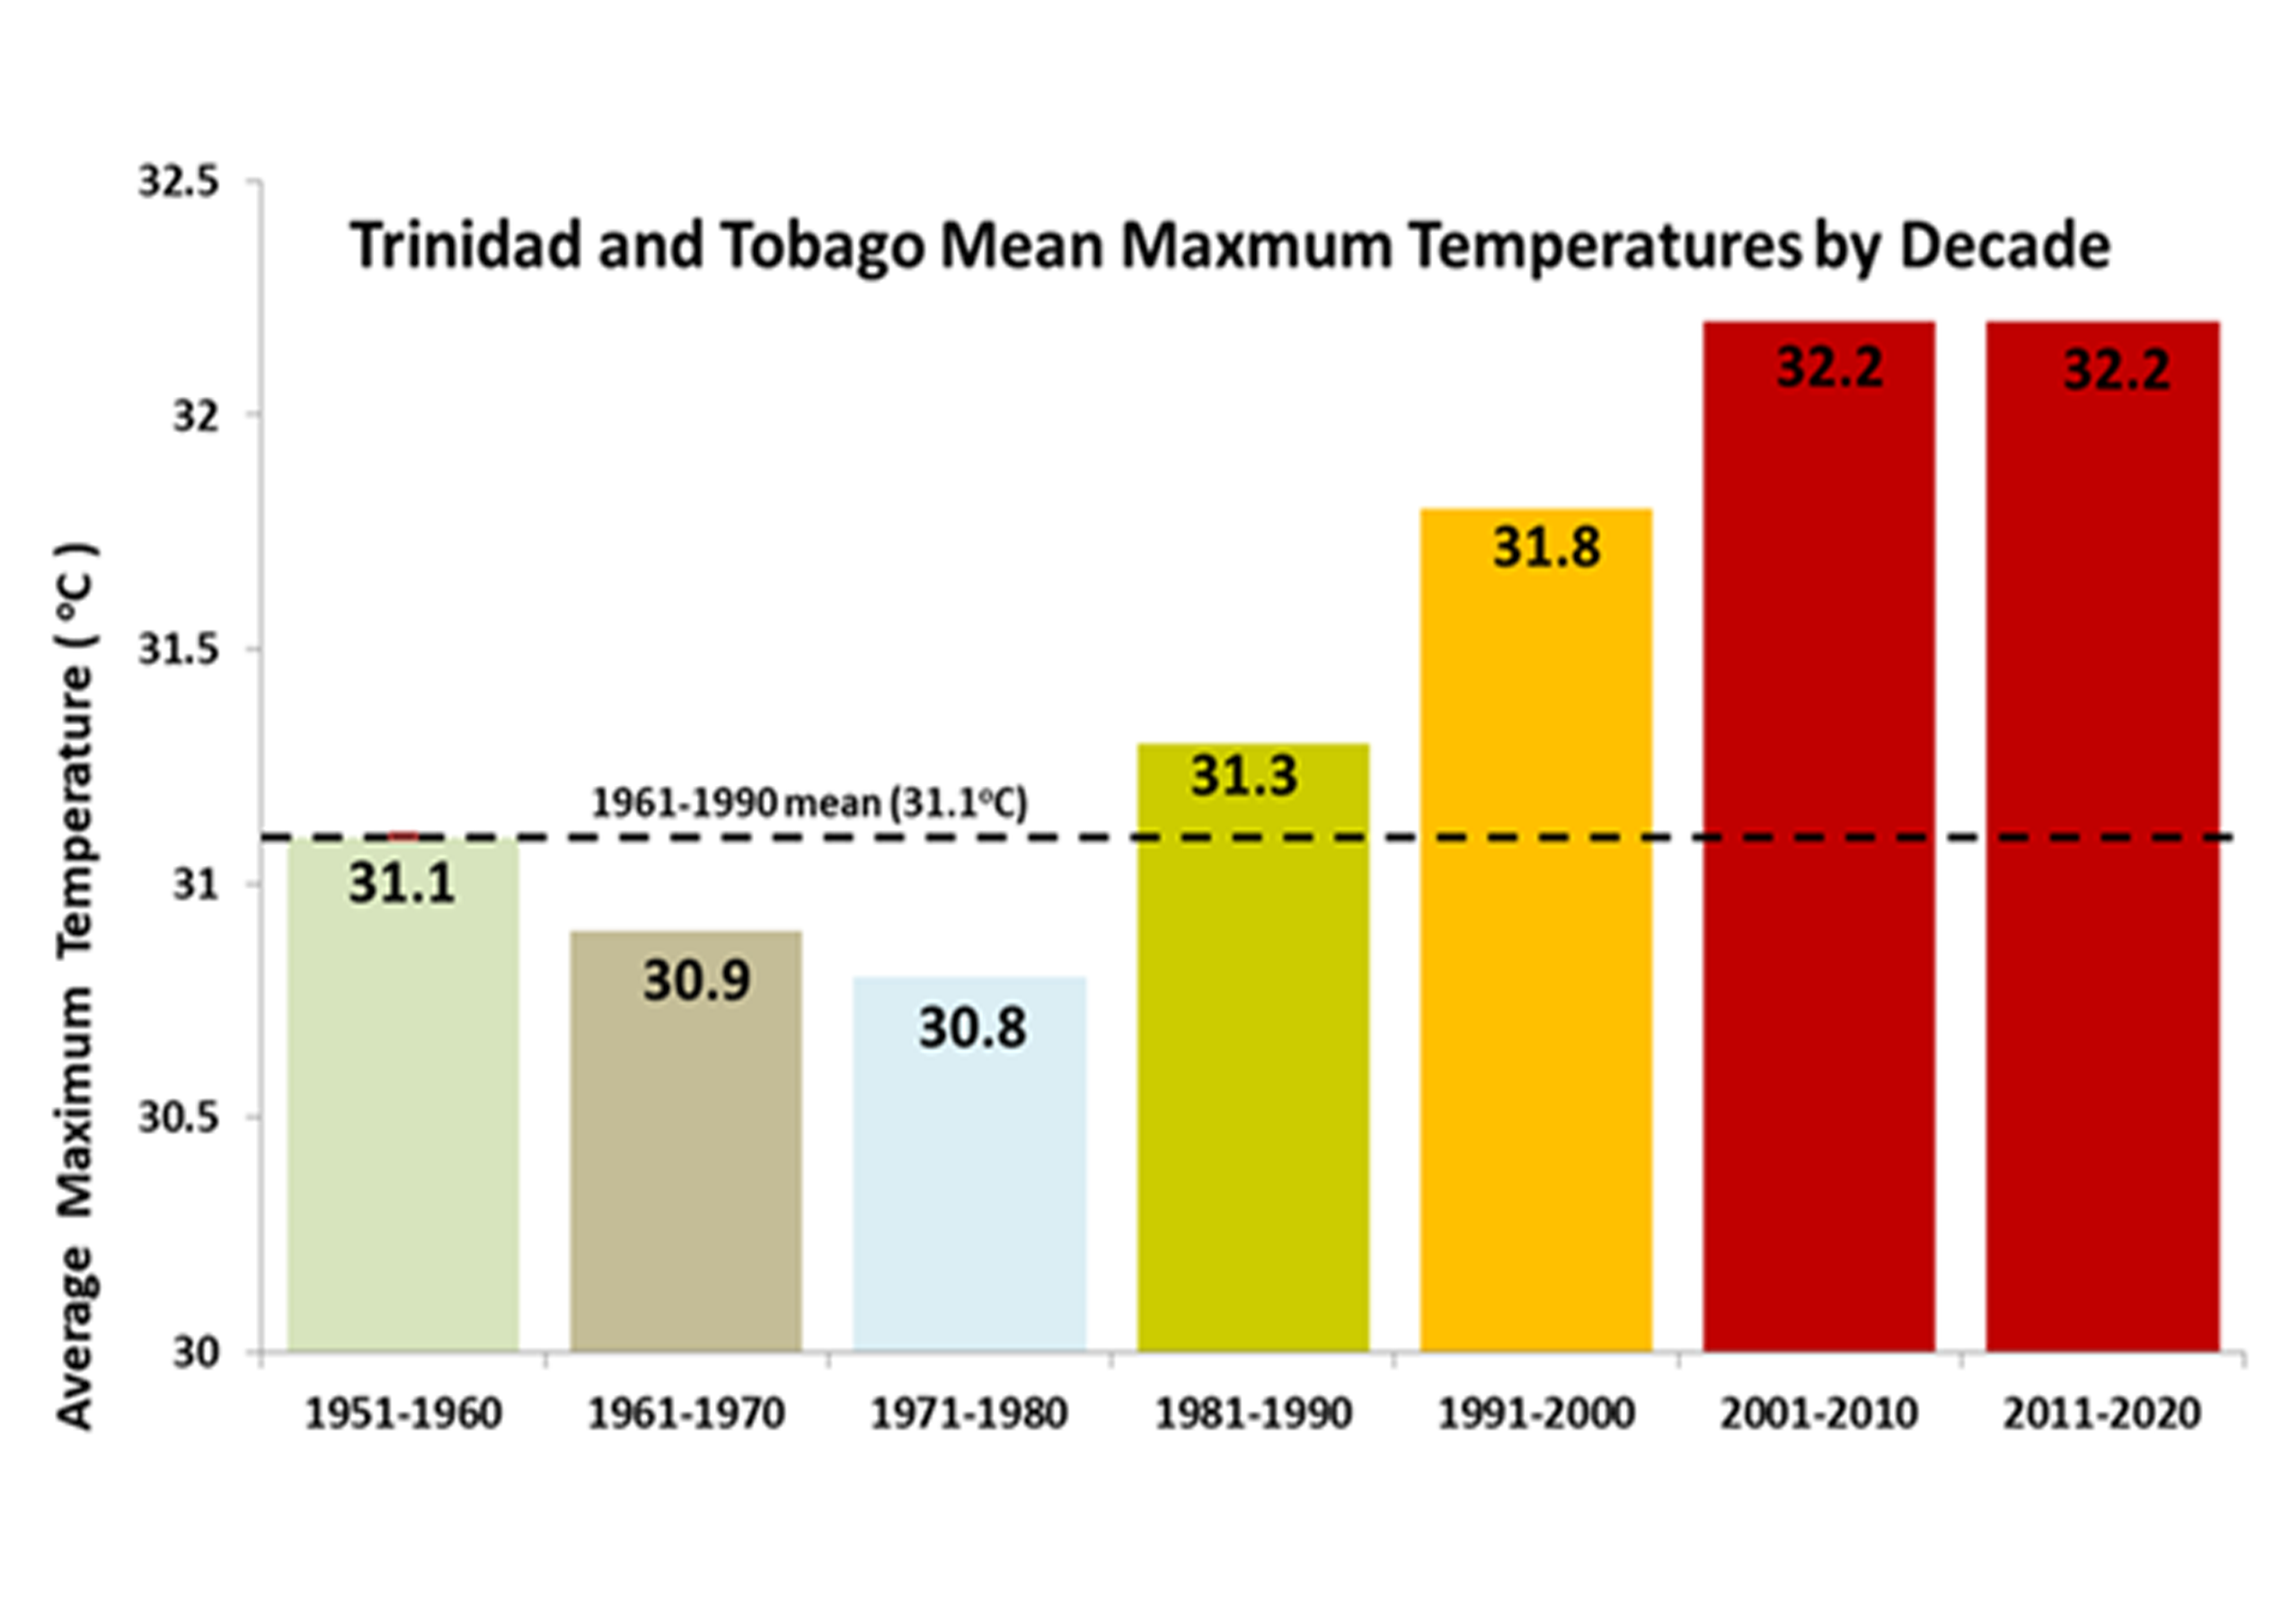
Decadal average daily maximum temperatures at Piarco, Trinidad have risen by about 1.1 ºC between 1951 and 2020, showing clear evidence of climate change impacts in the region.
HOT DAYS TRENDS
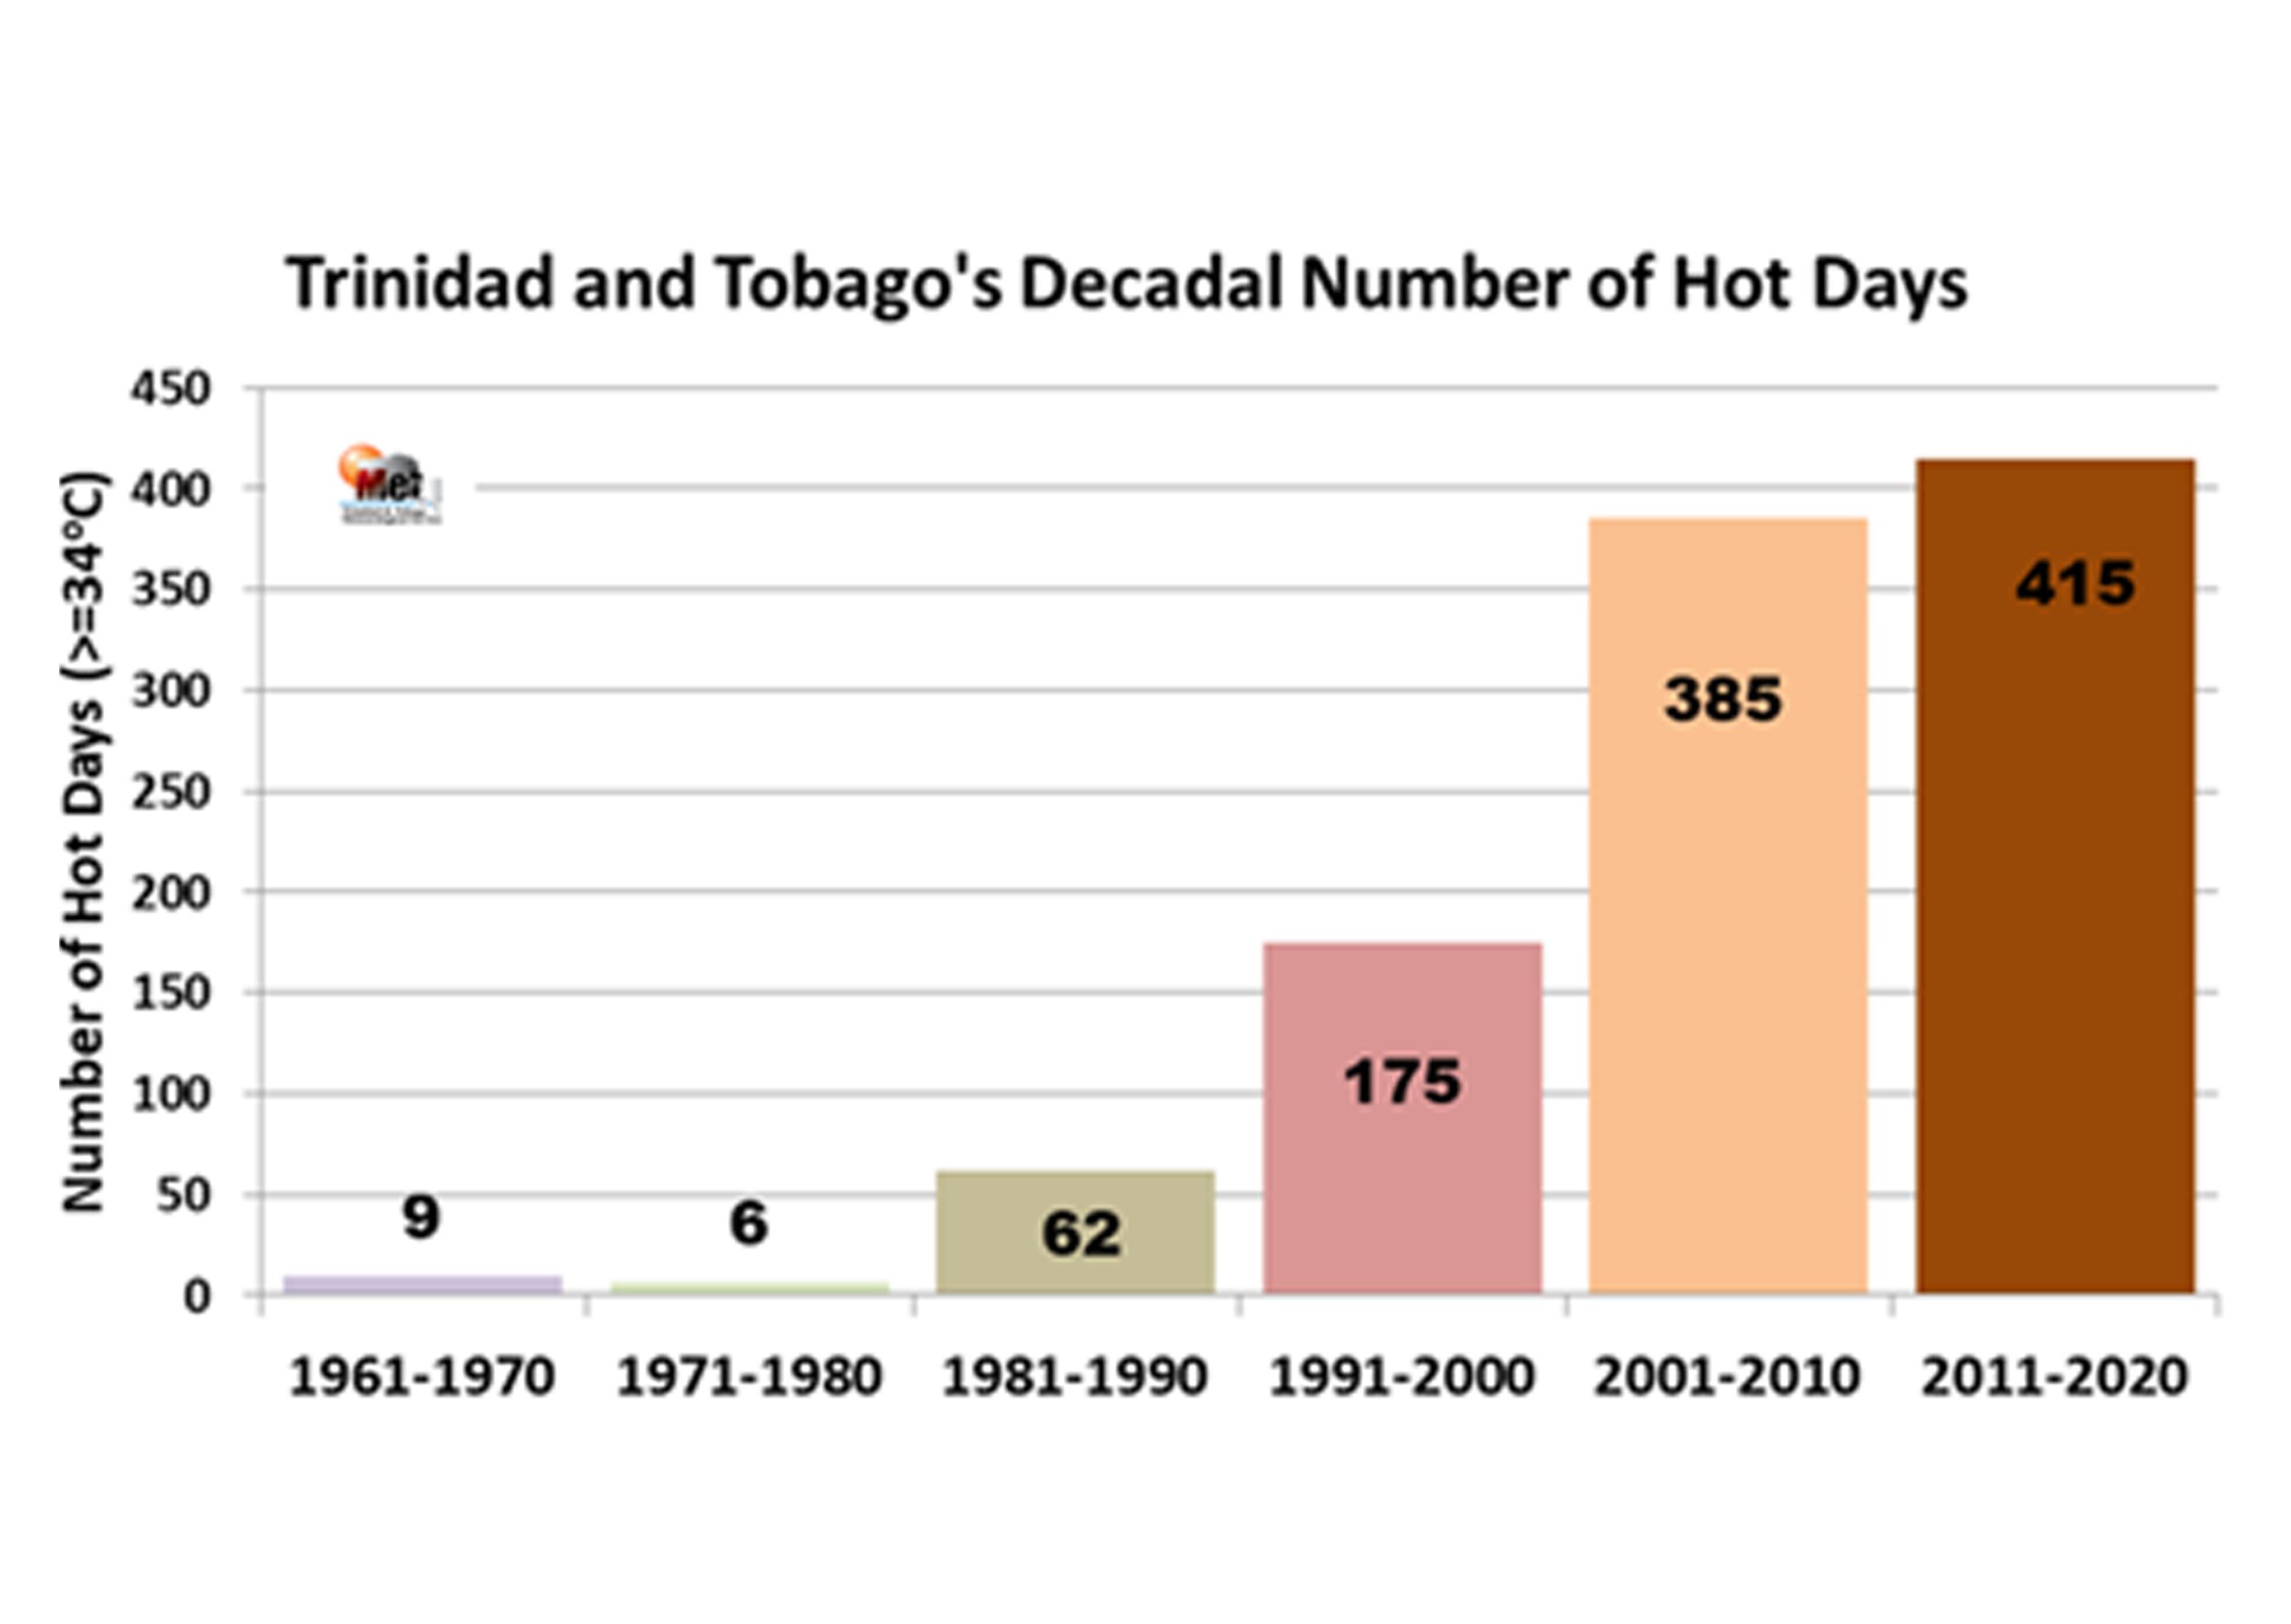
The graphic shows the decadal trend in hot days in Trinidad and Tobago from 1960-to 2020. A hot day is a day when the maximum temperature equals or exceeds 34°C (the 95th percentile). Hot days in the last decade have occurred more than twice the amount of hot days in the 1990s.
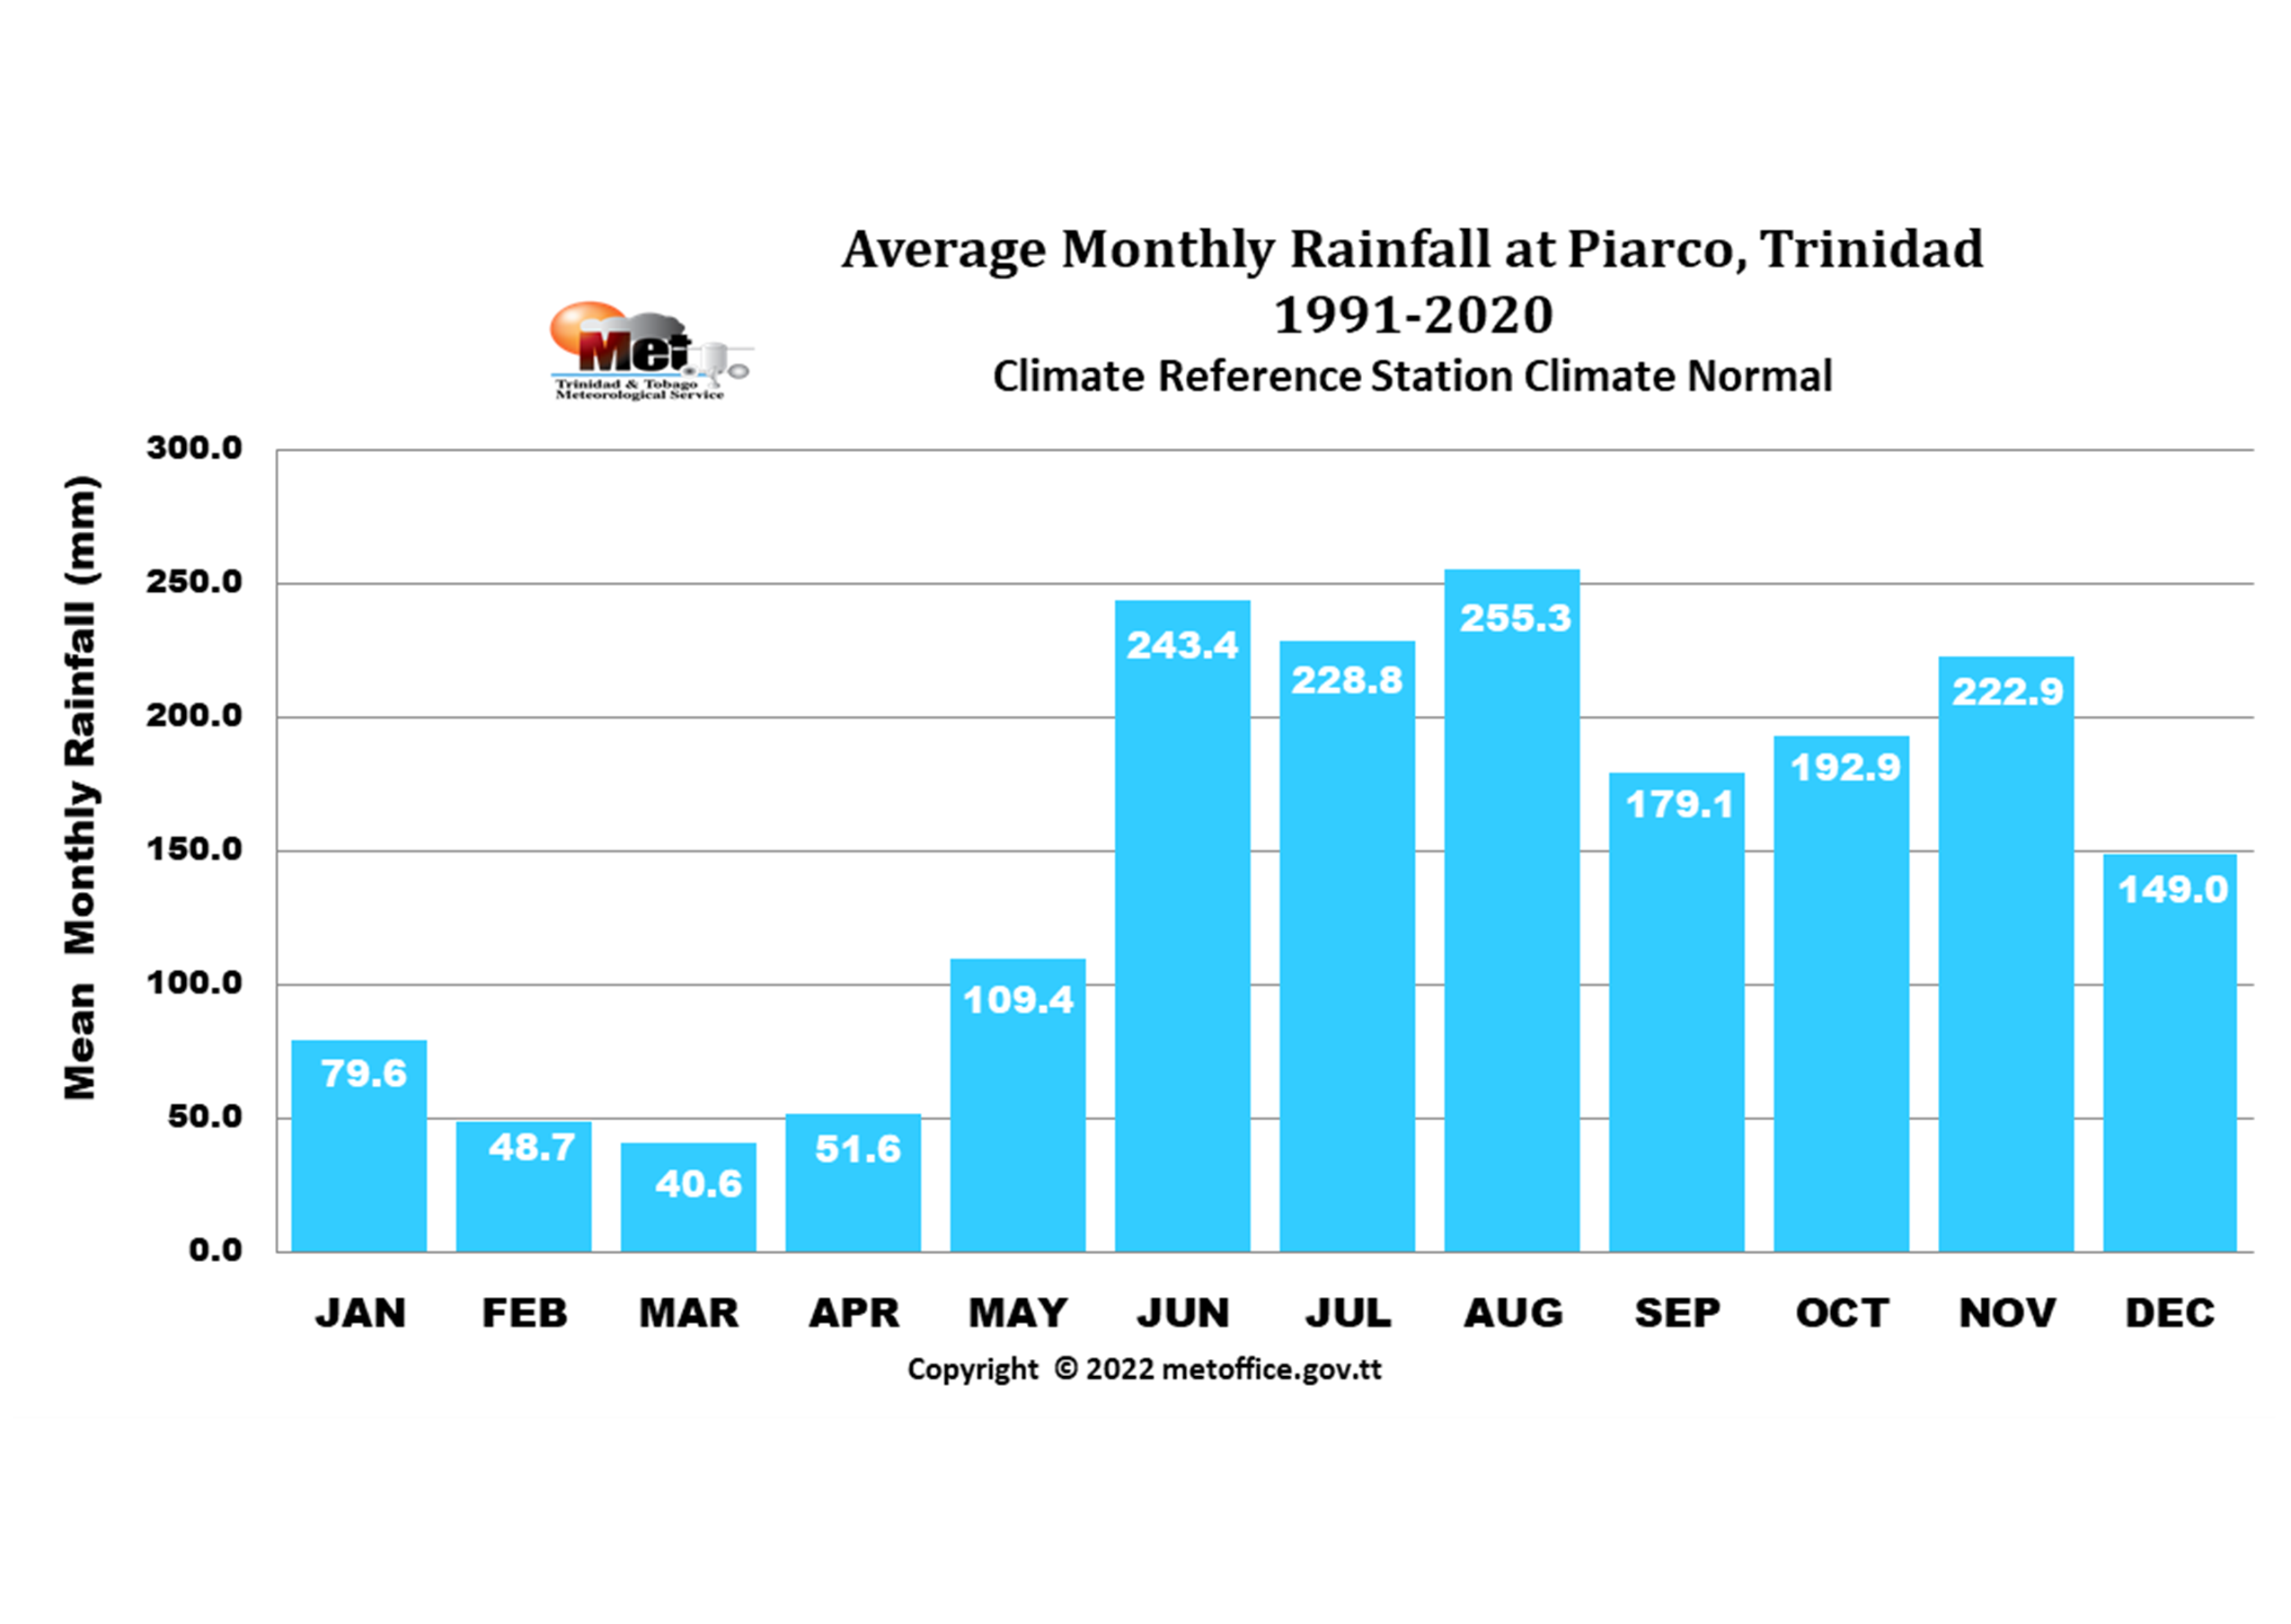
RAINFALL PATTERNS - PIARCO
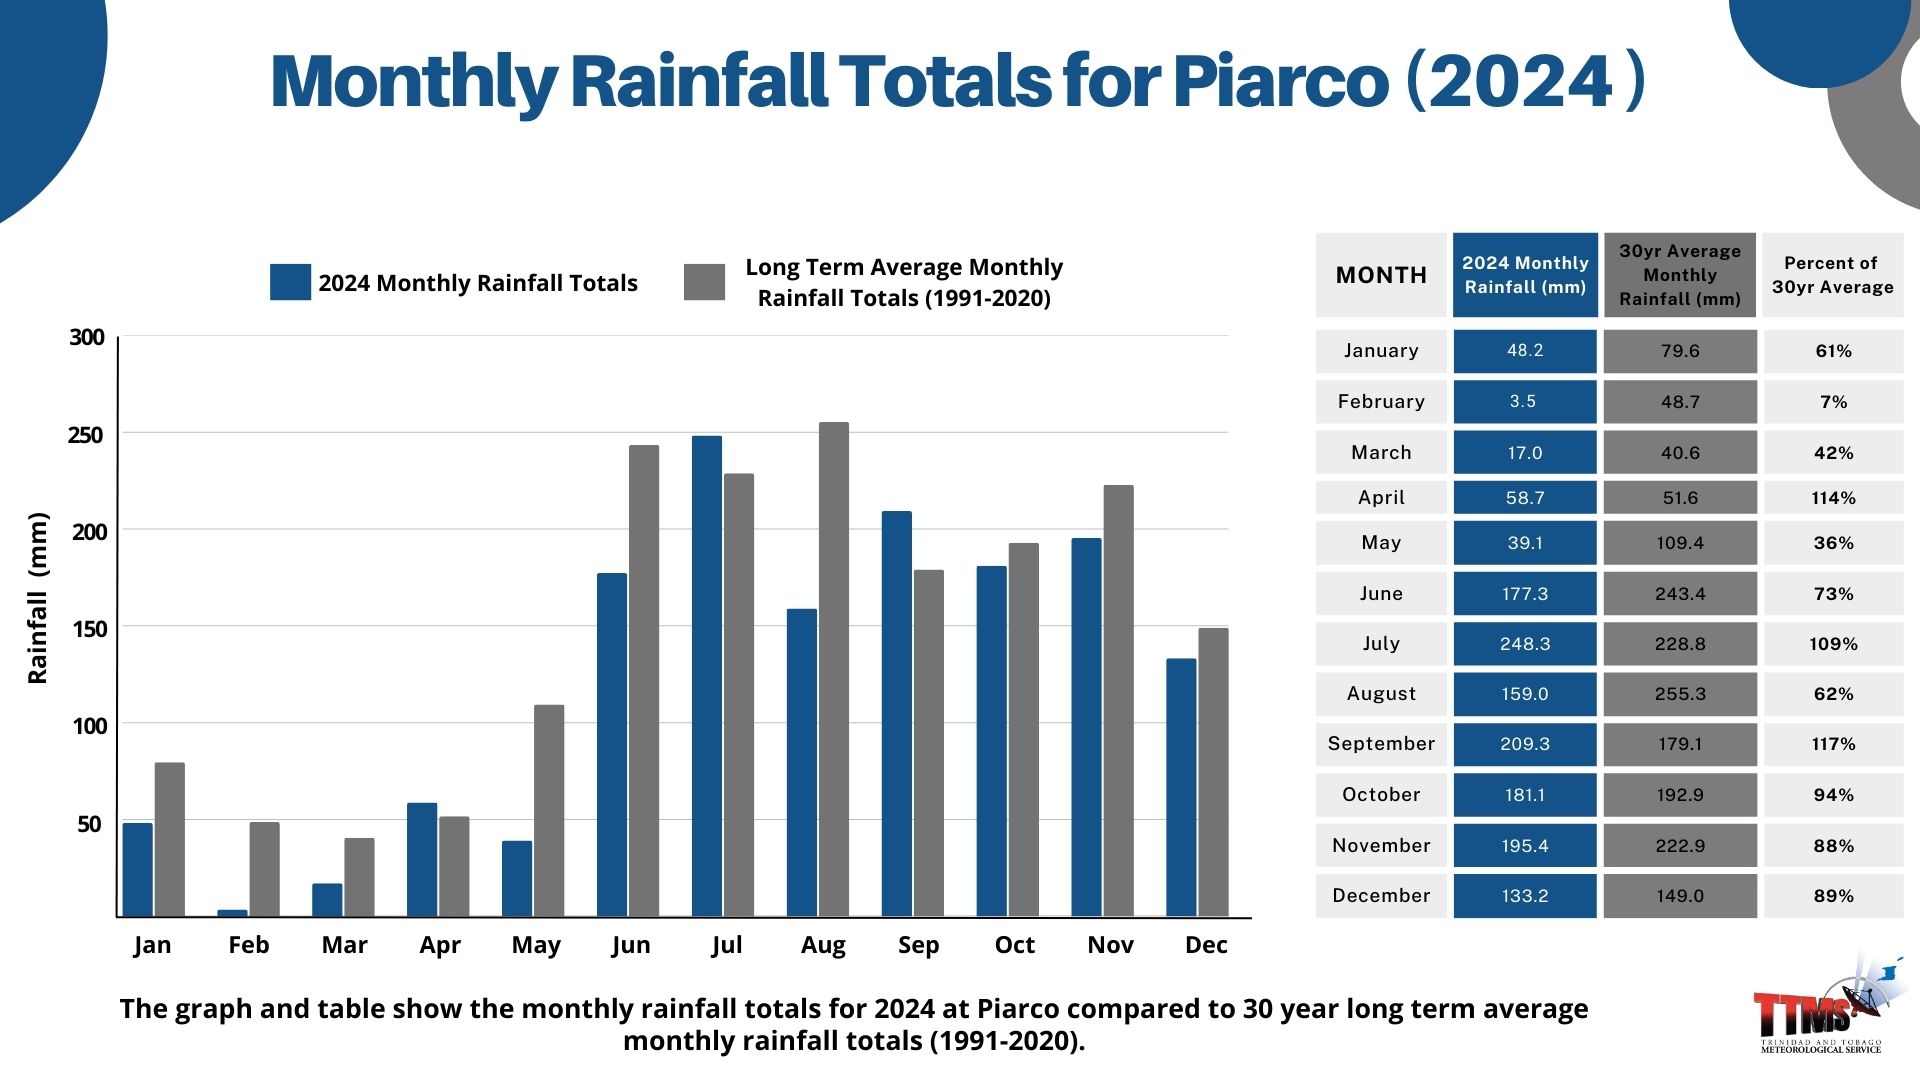
At Piarco (1991–2020), August is the wettest month (255.3 mm), followed by June and July. September is the driest wet-season month (179.1 mm) and sometimes has a short dry spell. March is the driest month overall (40.6 mm).
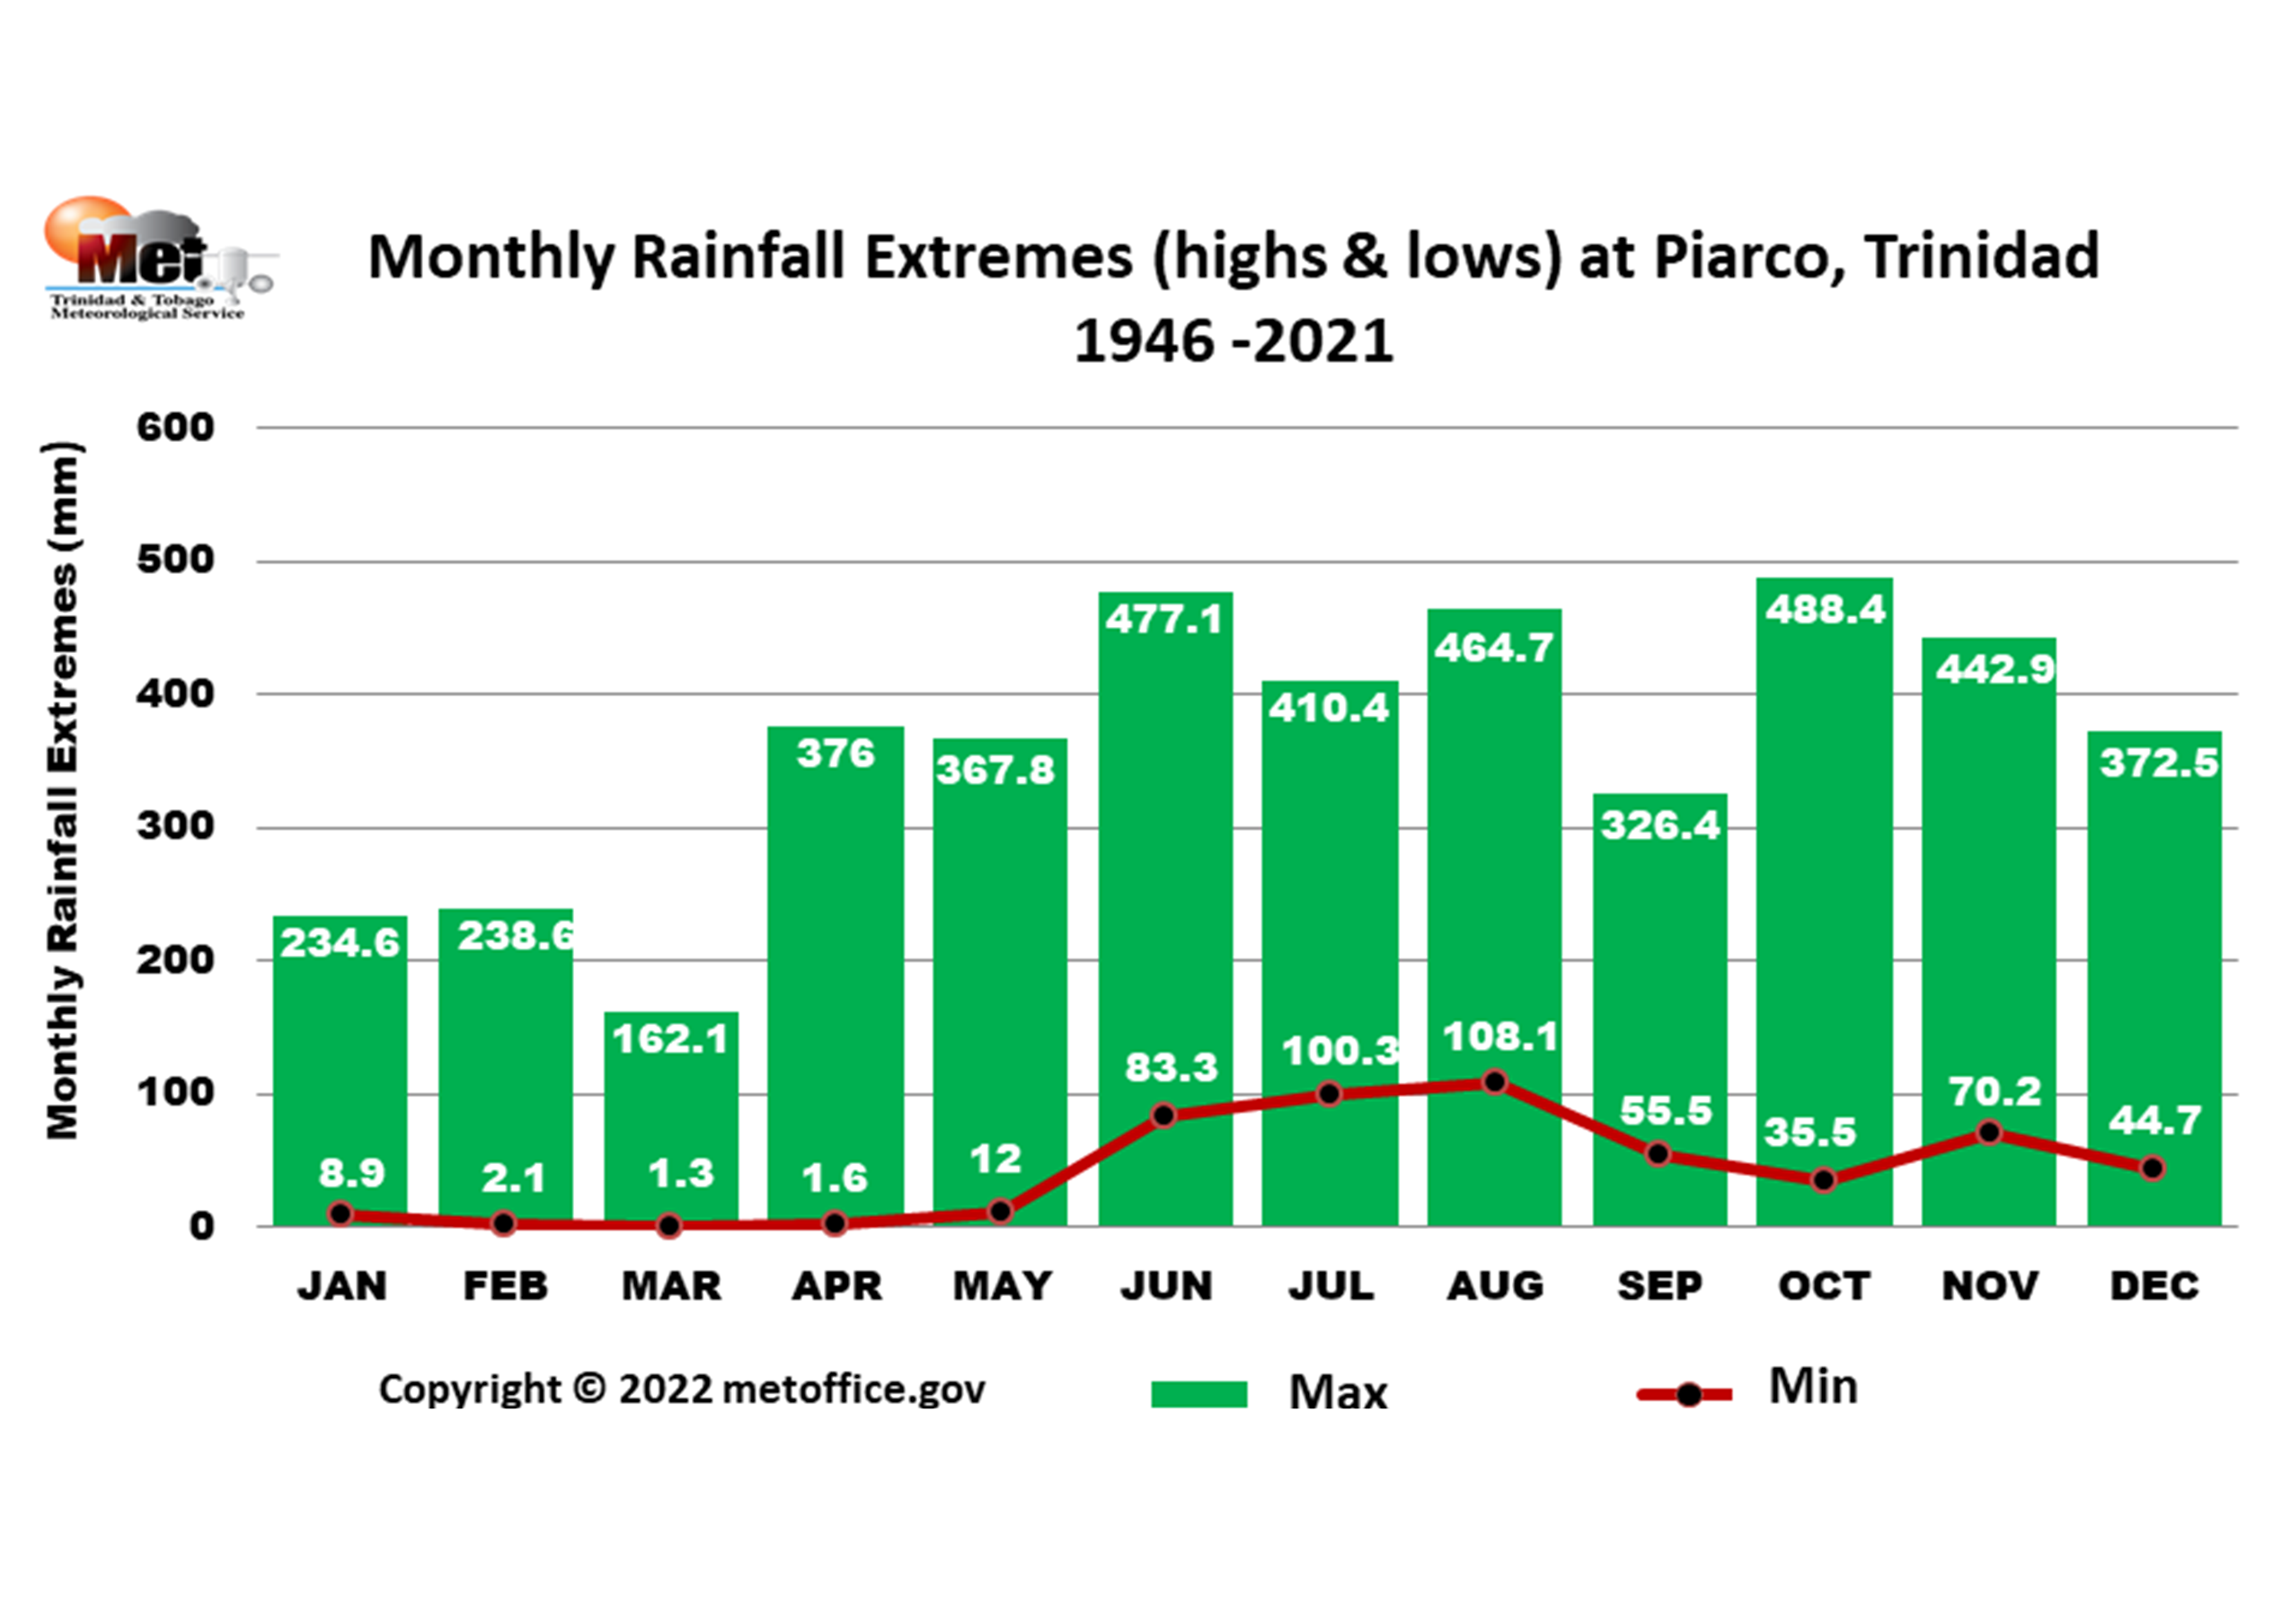
EXTREME RAINFALL RECORDS
Monthly extreme rainfall records at Piarco show the highest recorded rainfall amounts for each month, helping to understand the potential for extreme weather events throughout the year.
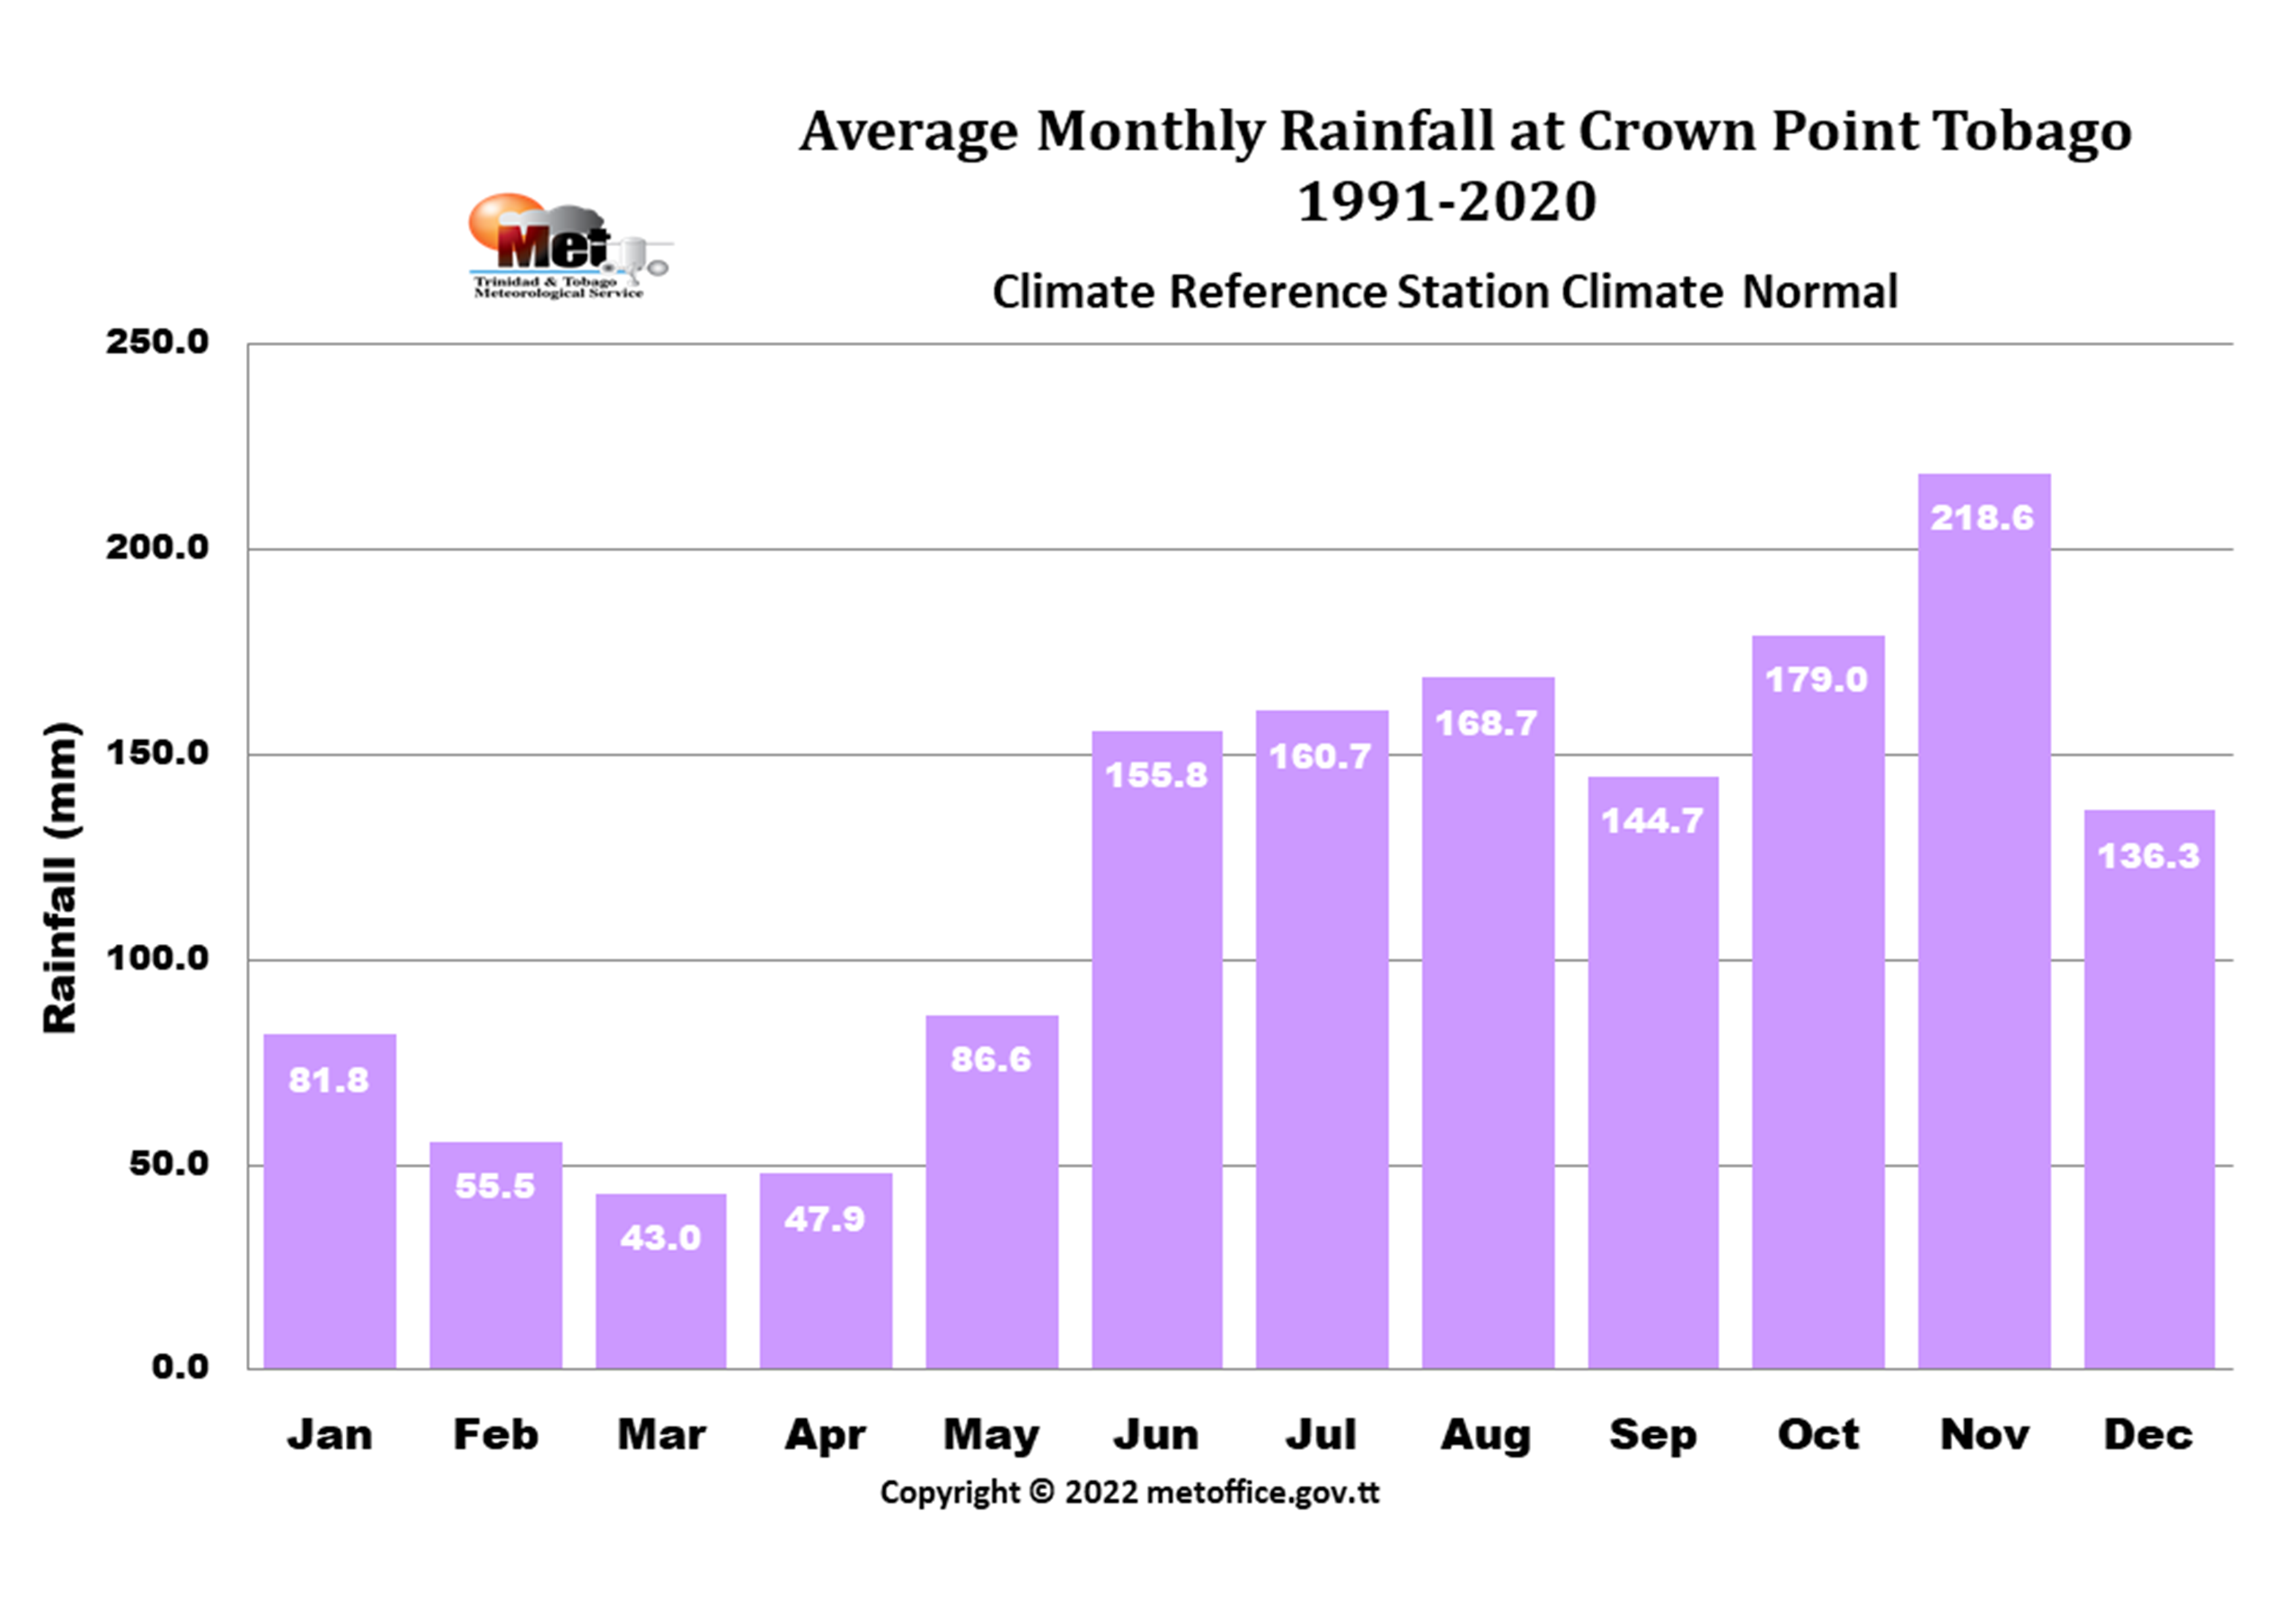
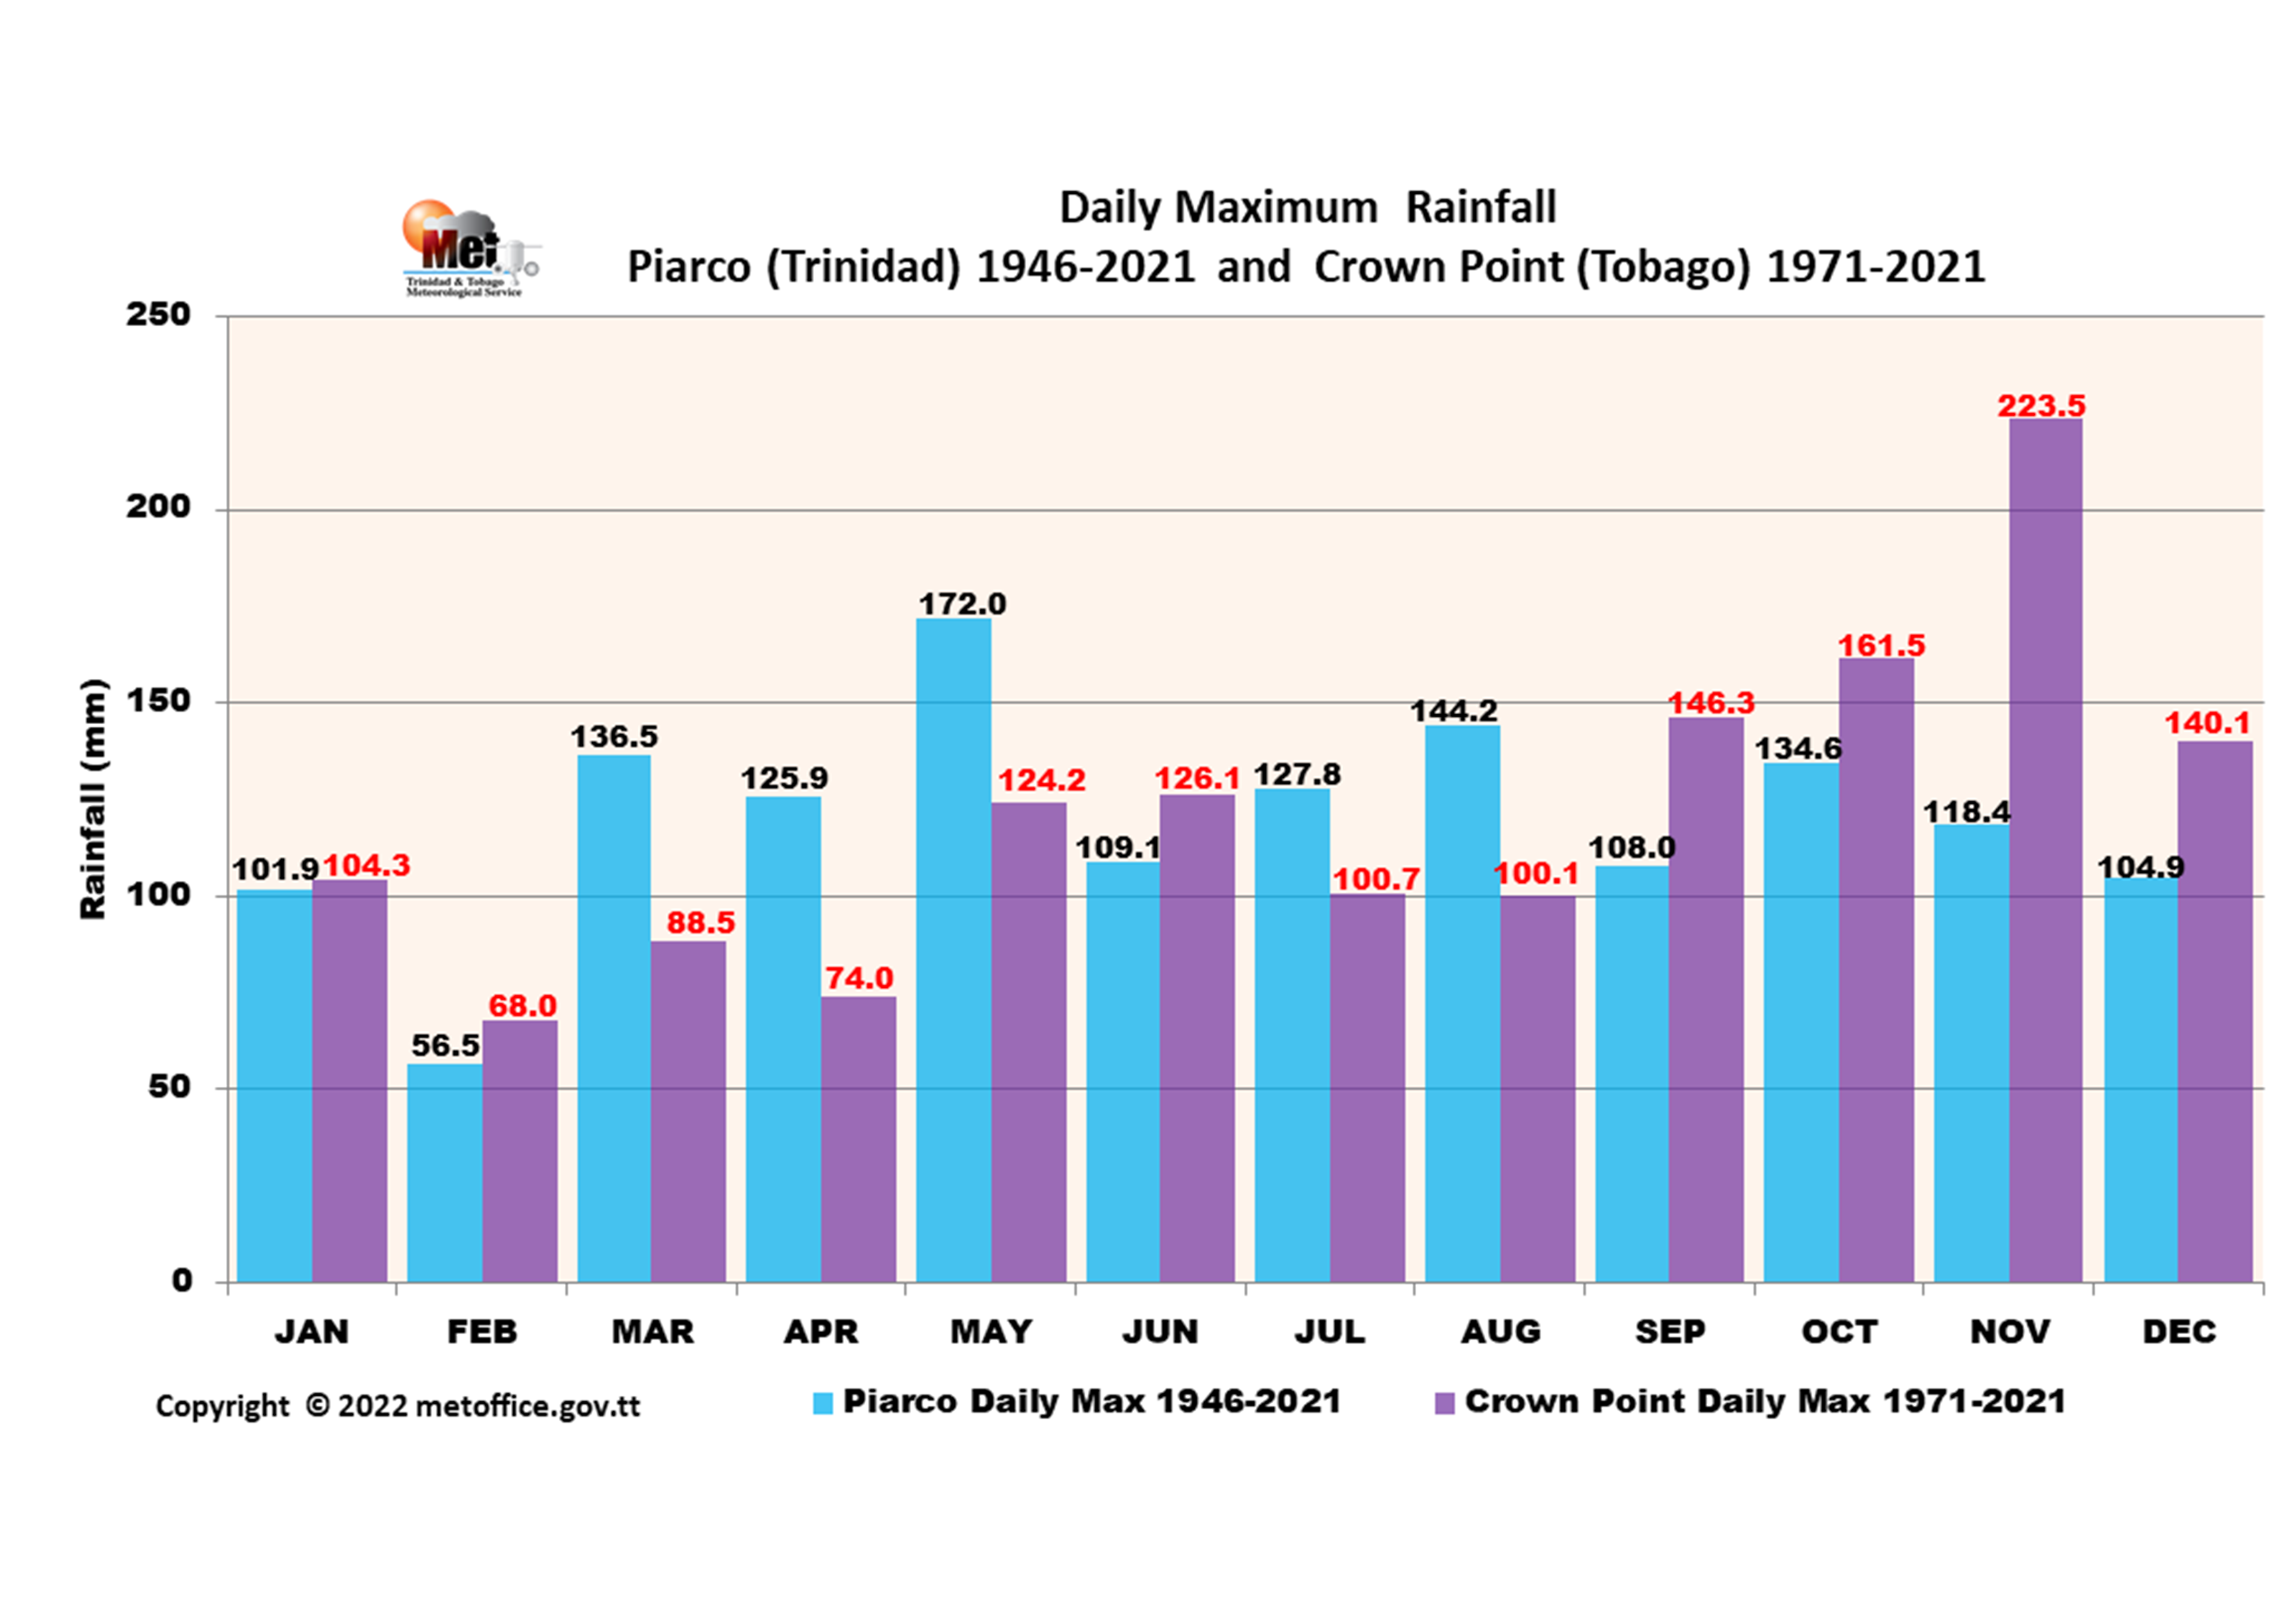
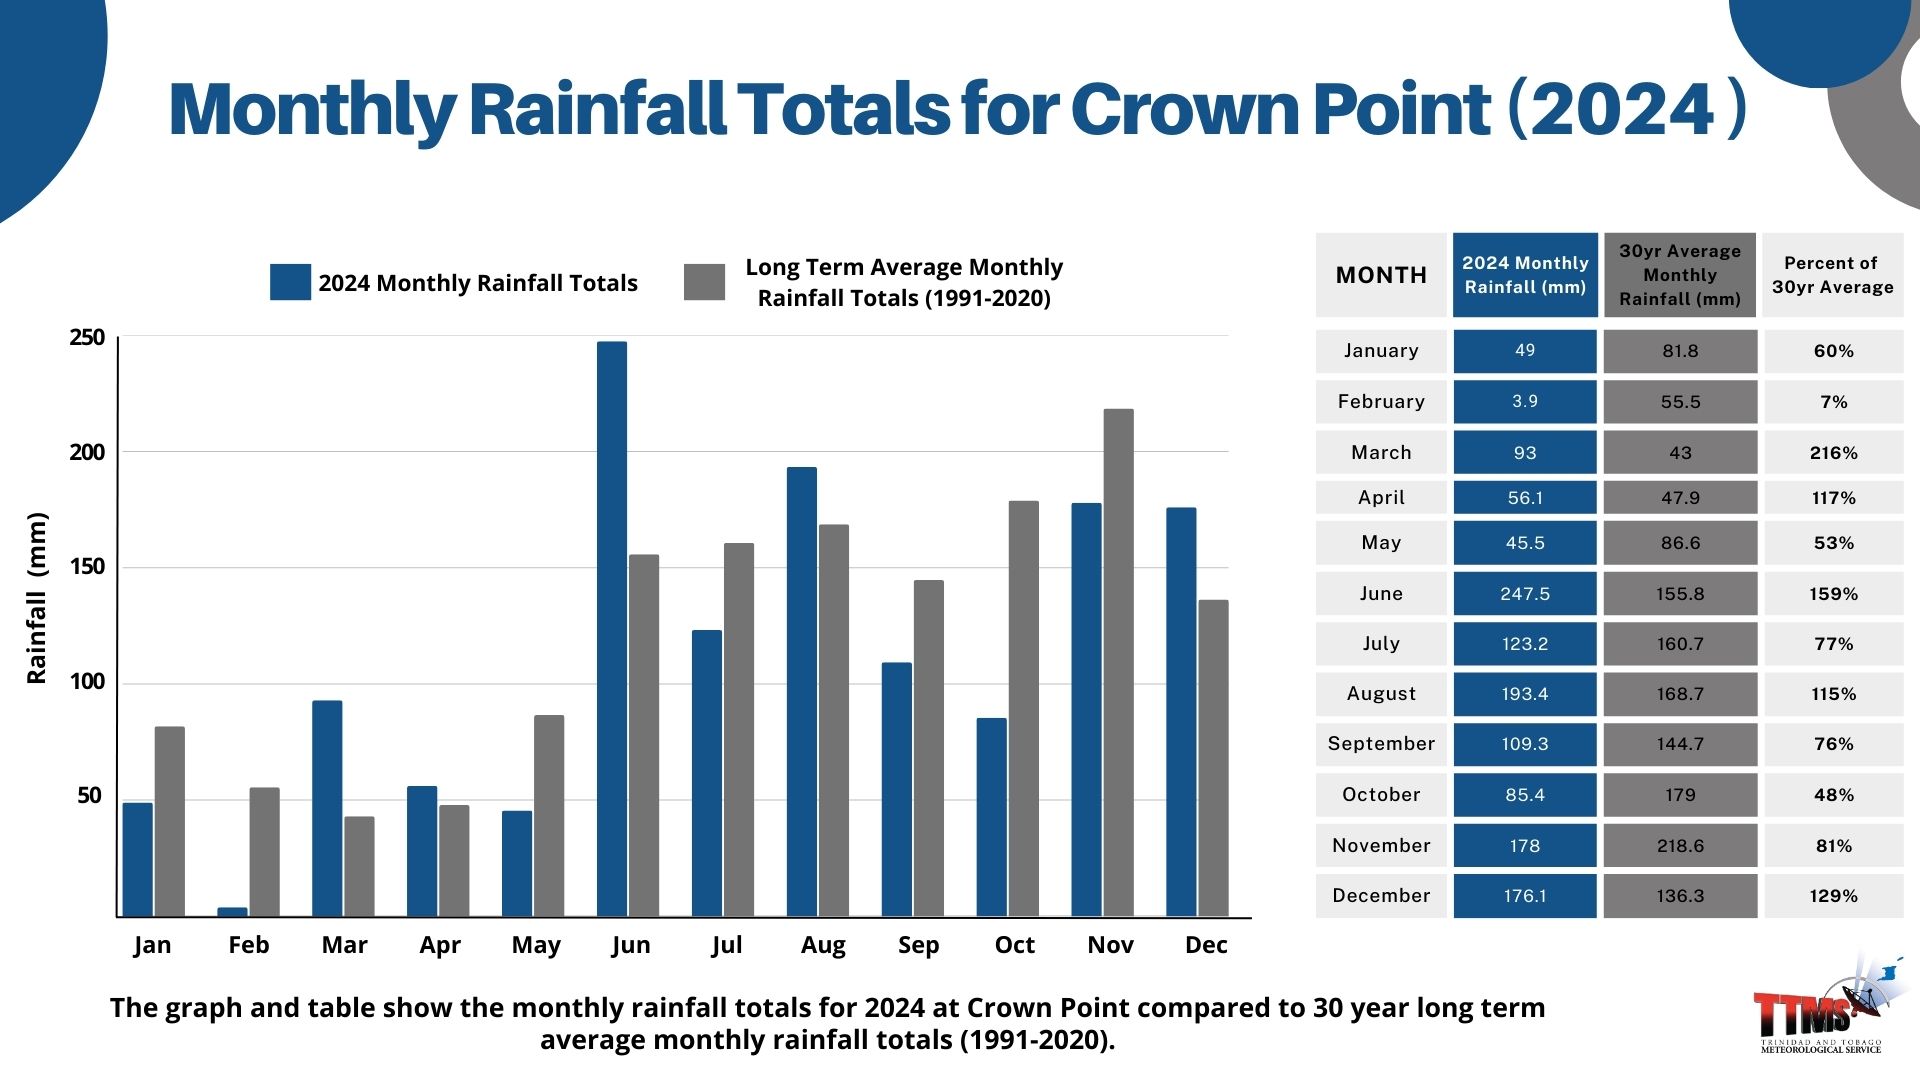
RAINFALL PATTERNS - CROWN POINT
At Crown Point (1991–2020), November is the wettest month (218.6 mm), followed by October (179.0 mm). December is the driest wet-season month (136.3 mm), while March is the driest month overall (43.0 mm).
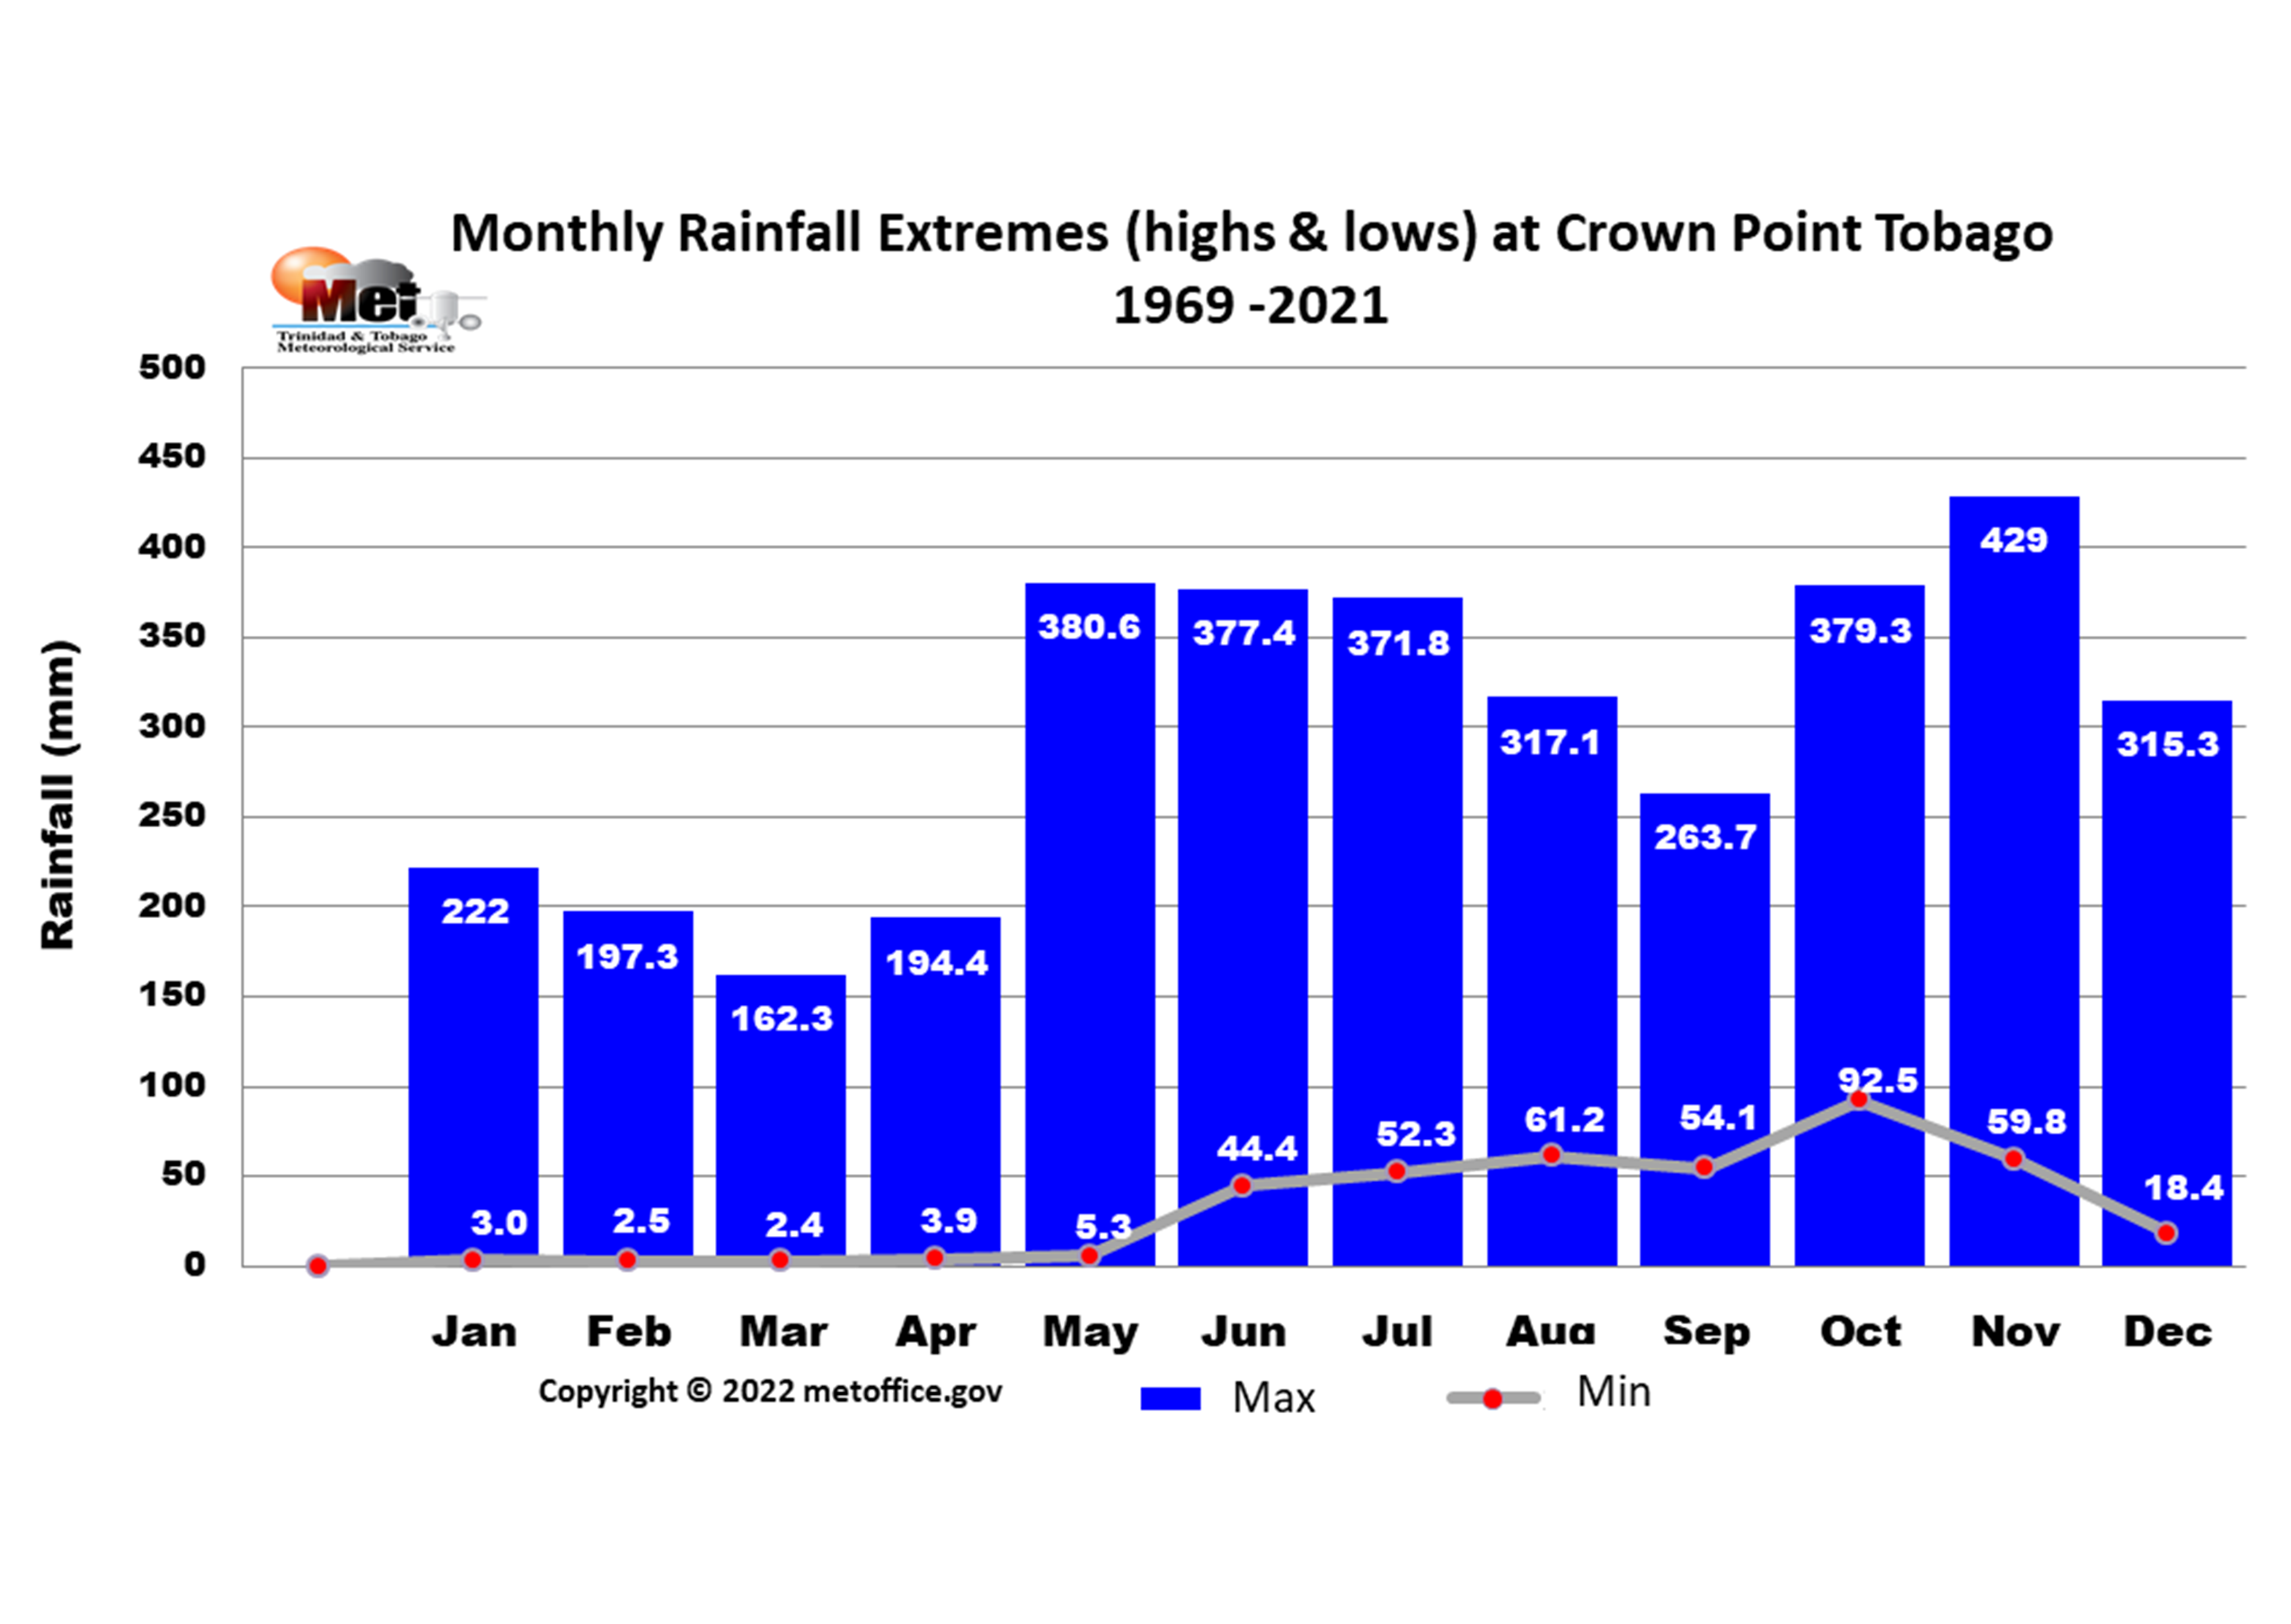
EXTREME RAINFALL - CROWN POINT
At Crown Point (1971–2021), November 2004 recorded the highest monthly rainfall (429.0 mm), while March 1992 had the lowest (2.4 mm). These records show the extreme variability in rainfall patterns for Tobago.
DAILY RAINFALL RECORDS
The highest 24-hour rainfall recorded at Piarco (1946–2021) is 172.0 mm, which occurred on May 25, 2010. March, typically the driest month, had the 3rd highest 24-hour rainfall on March 4, 2018. At Crown Point (1971–2021), the highest 24-hour rainfall measured is 223.5 mm, recorded on November 12, 2004.
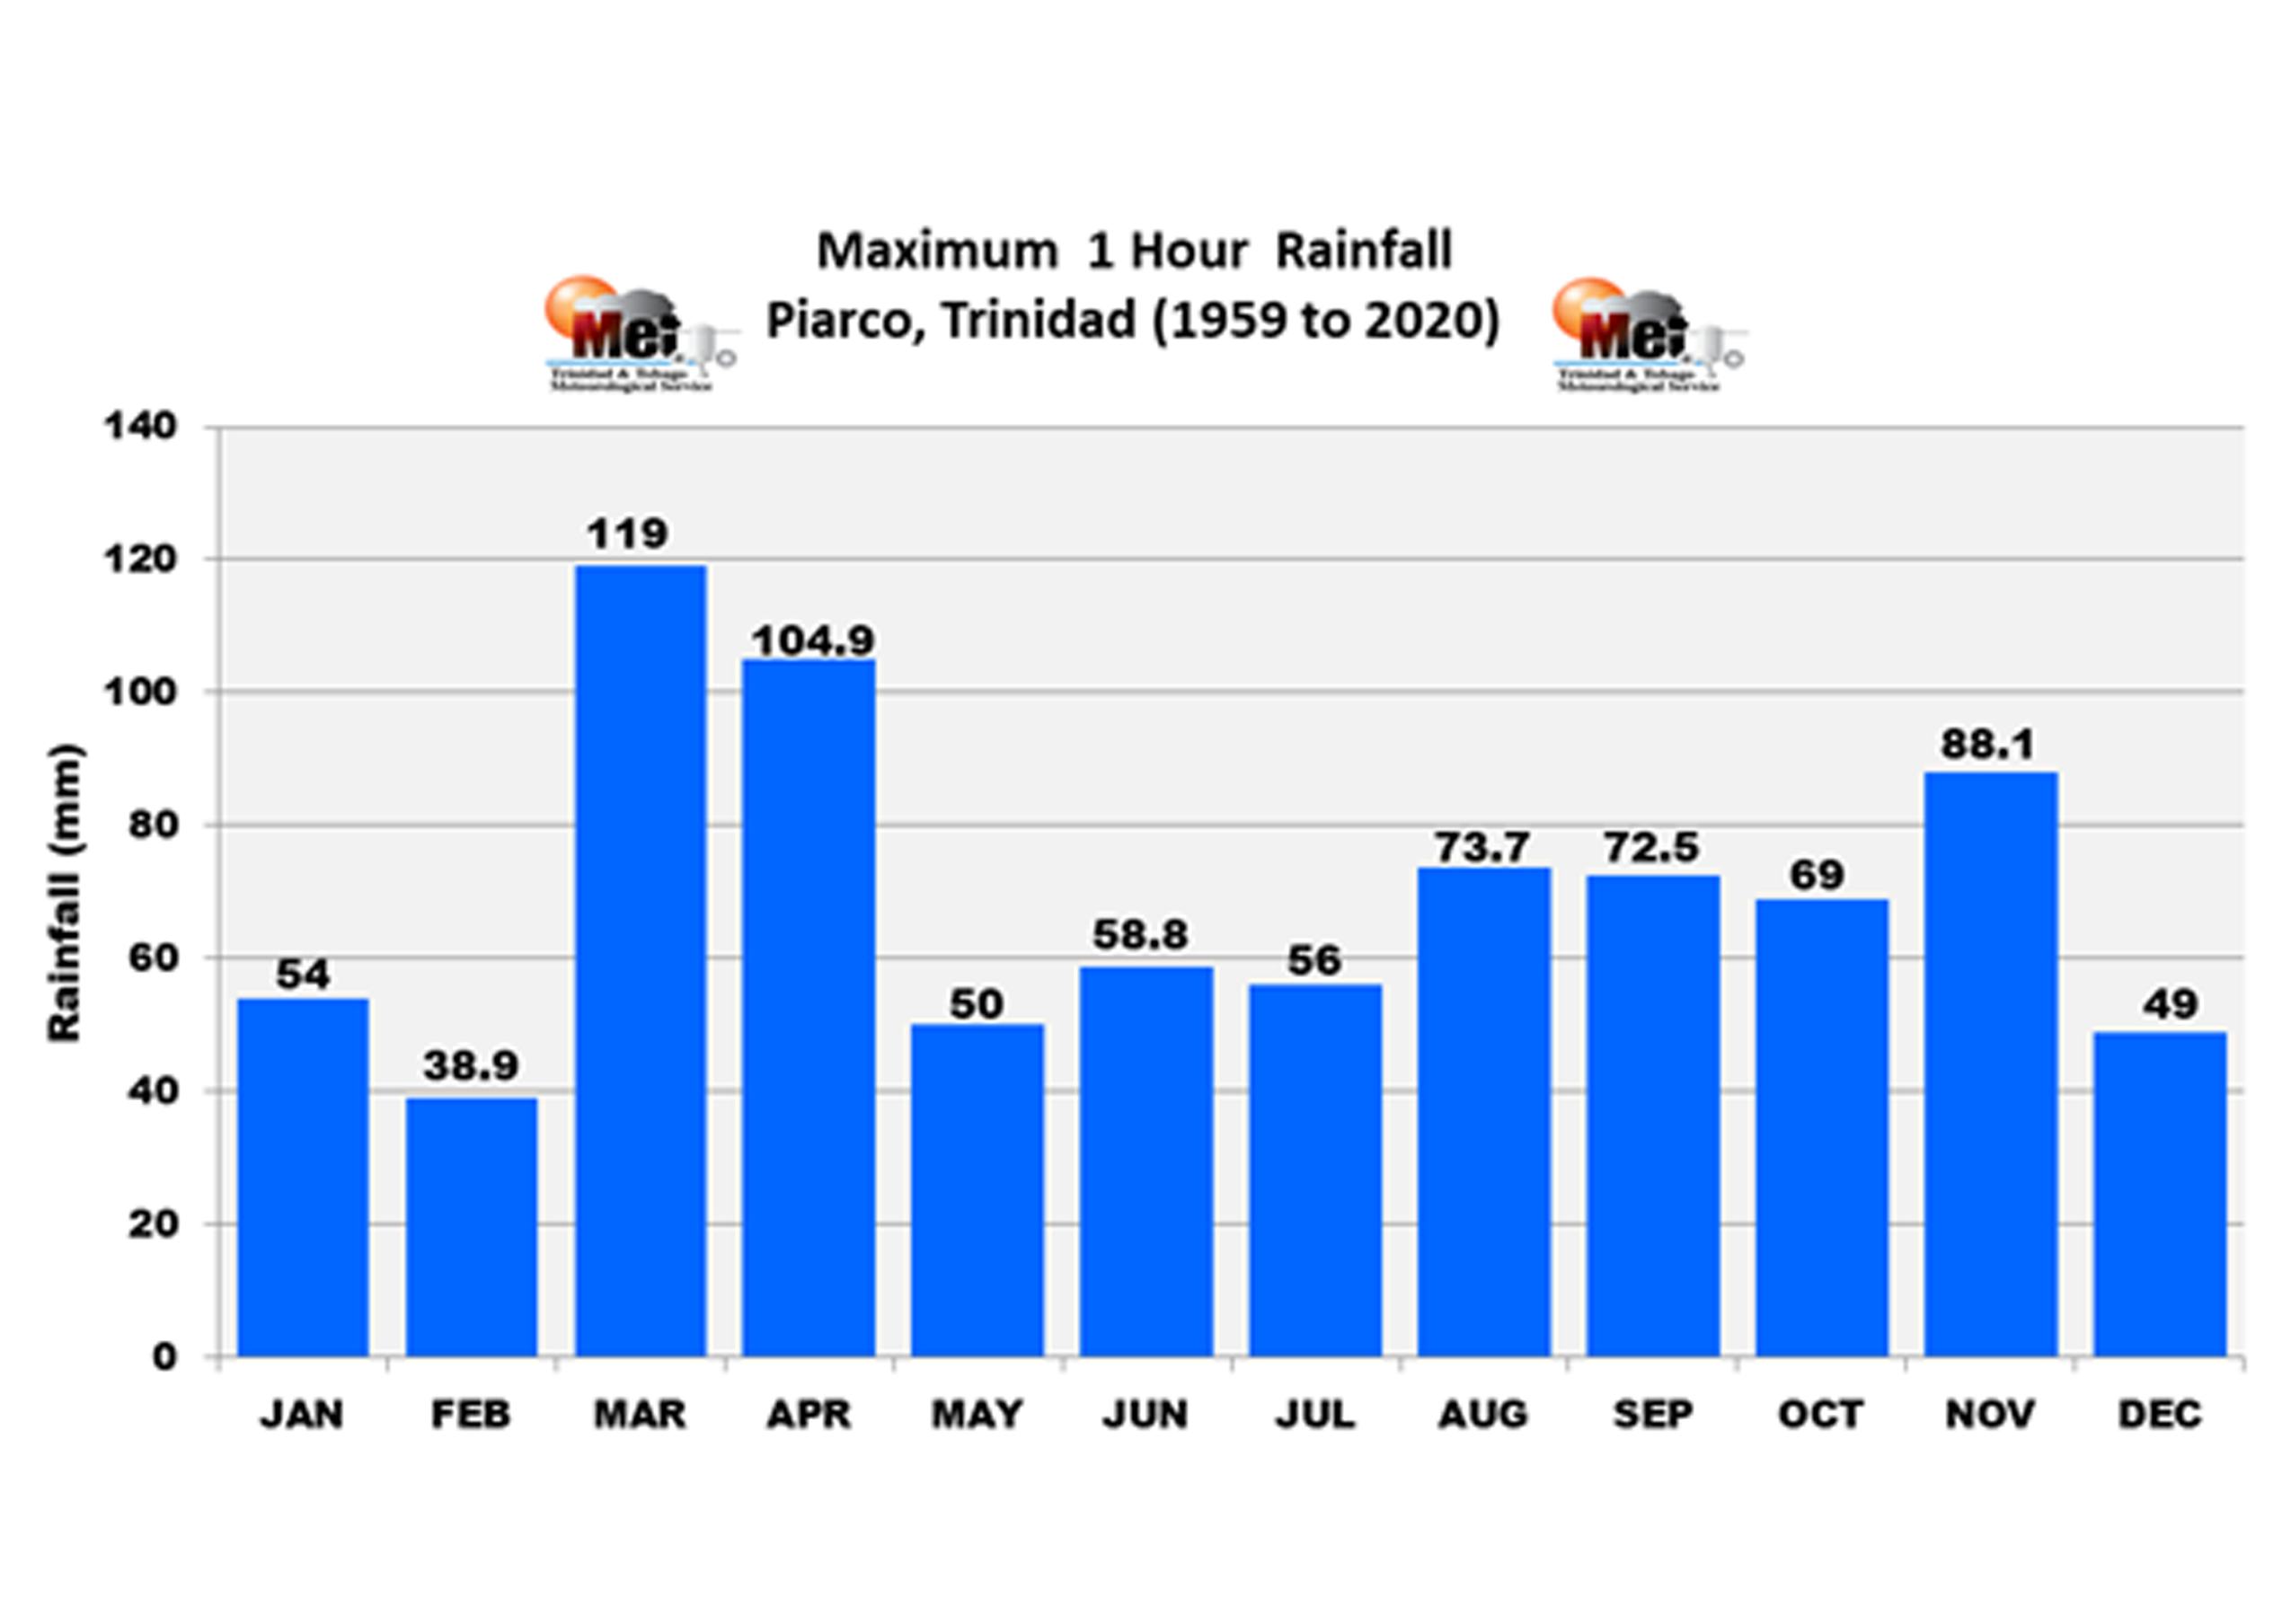
HOURLY RAINFALL RECORDS
The most rainfall in one (1) hour recorded at Piarco from 1946 to 2020 on the monthly scale is shown. The month of March, which is usually the driest month of the year has the record, which occurred on March 4th, 2018, followed by April, which occurred on April 22nd, 1973.
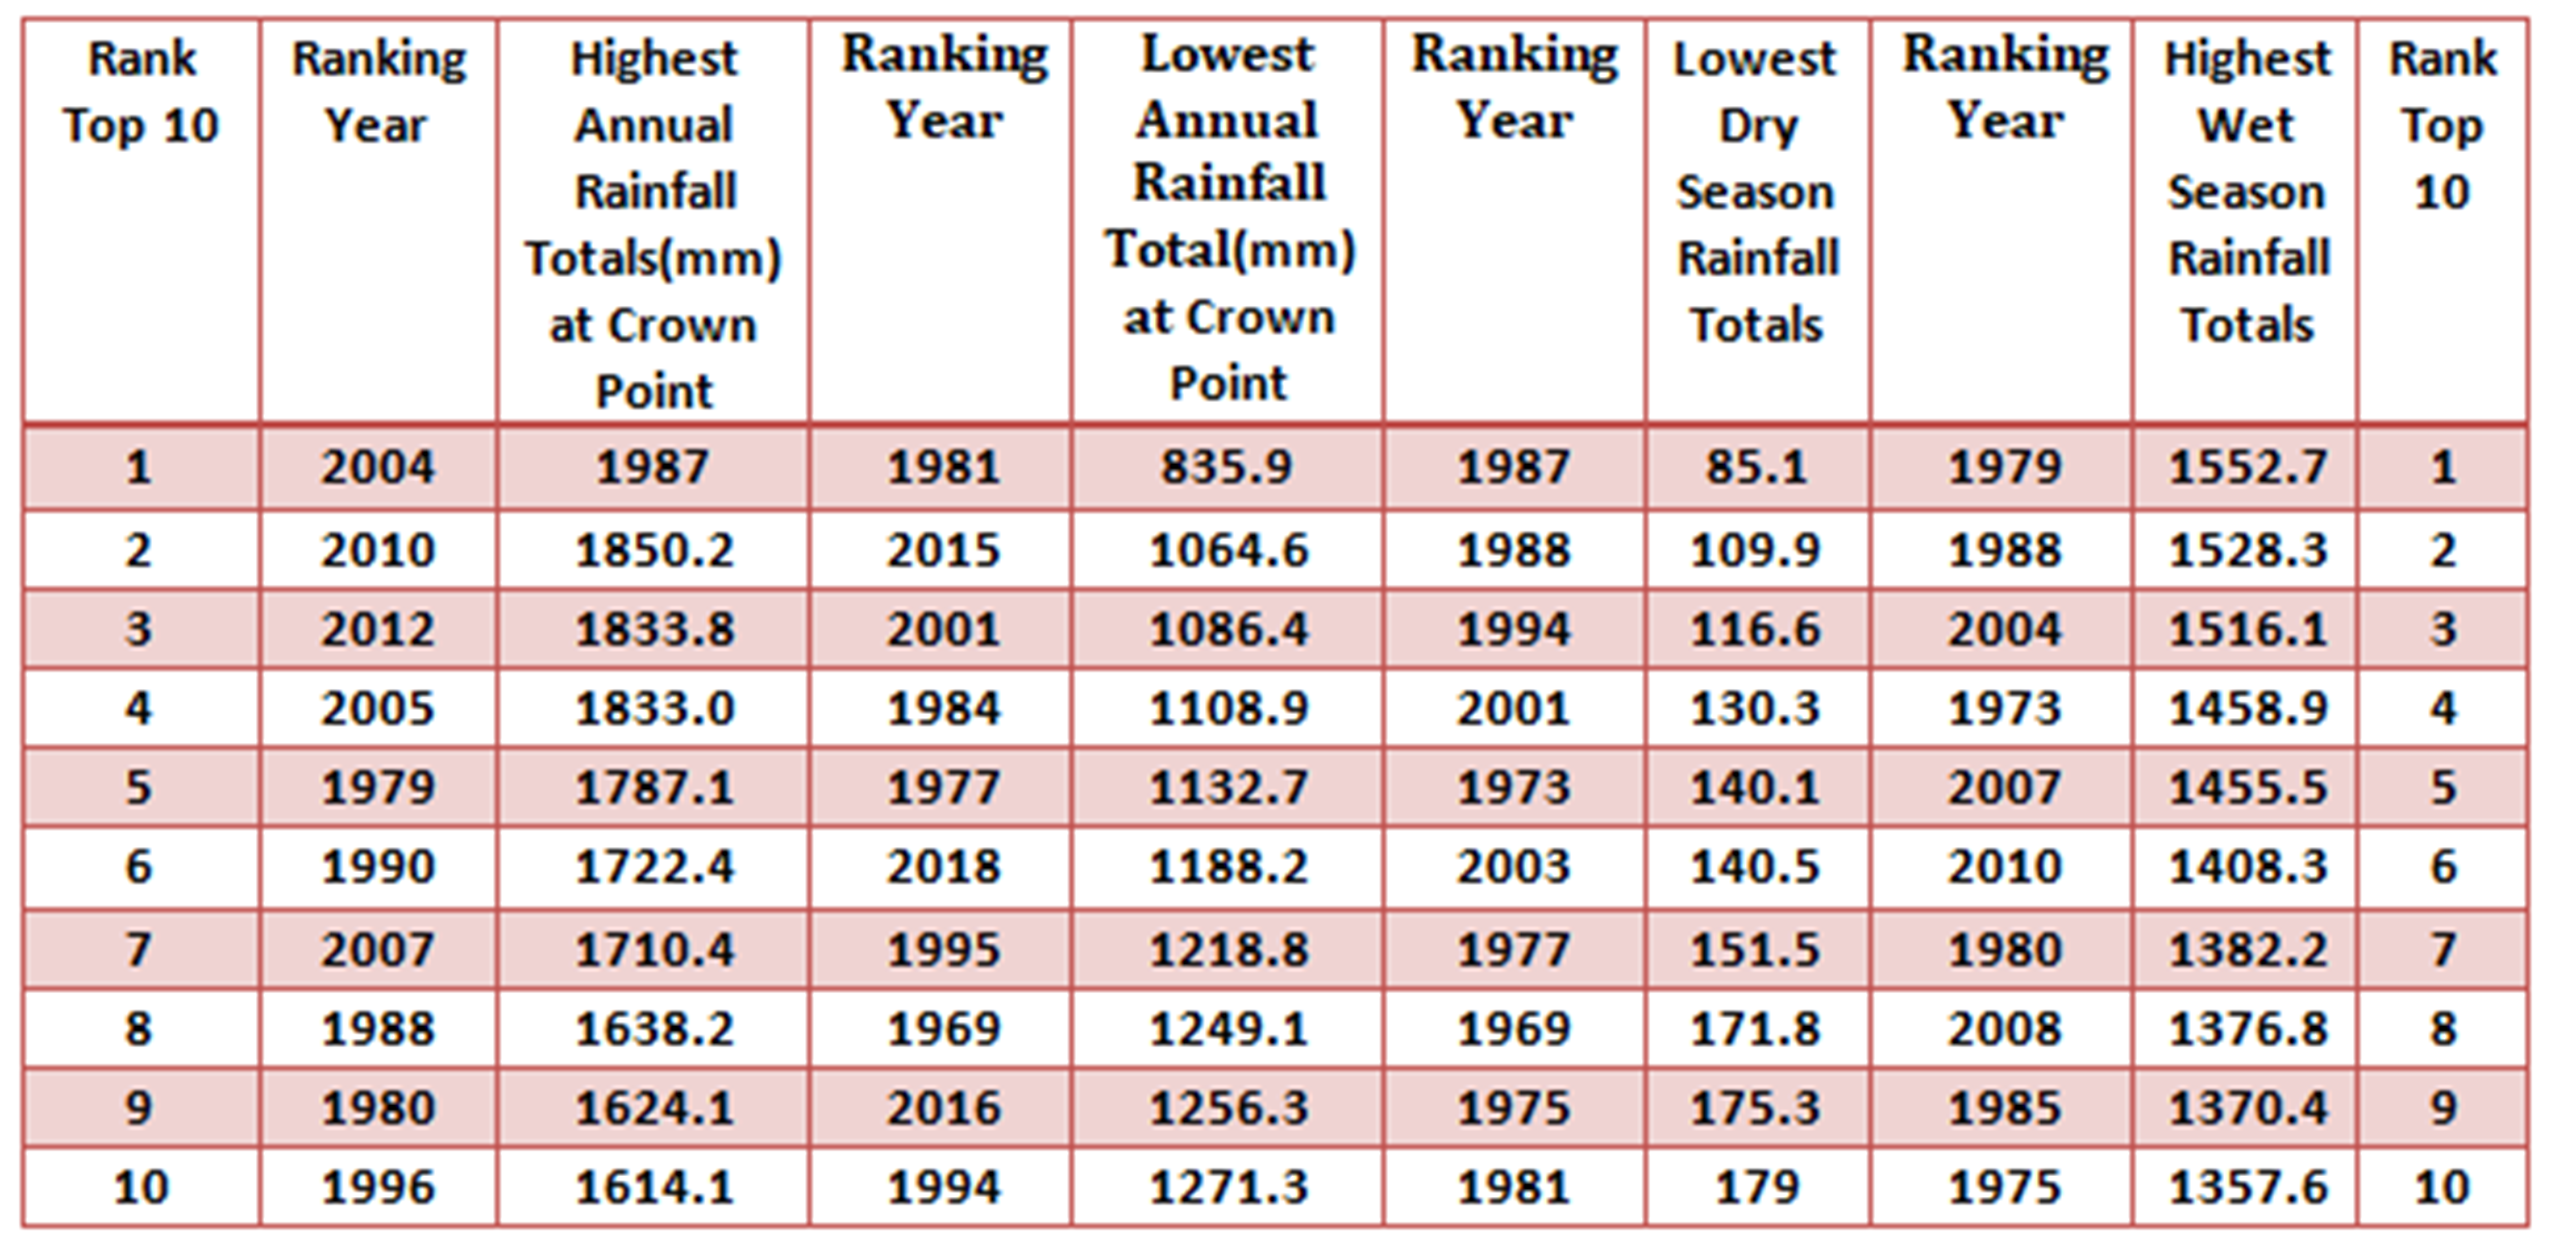
RAINFALL RANKINGS - CROWN POINT
The table displays the top ten highest and lowest annual, wet and dry-seasons rainfall records at Crown Point, Tobago, providing insights into extreme rainfall variability.
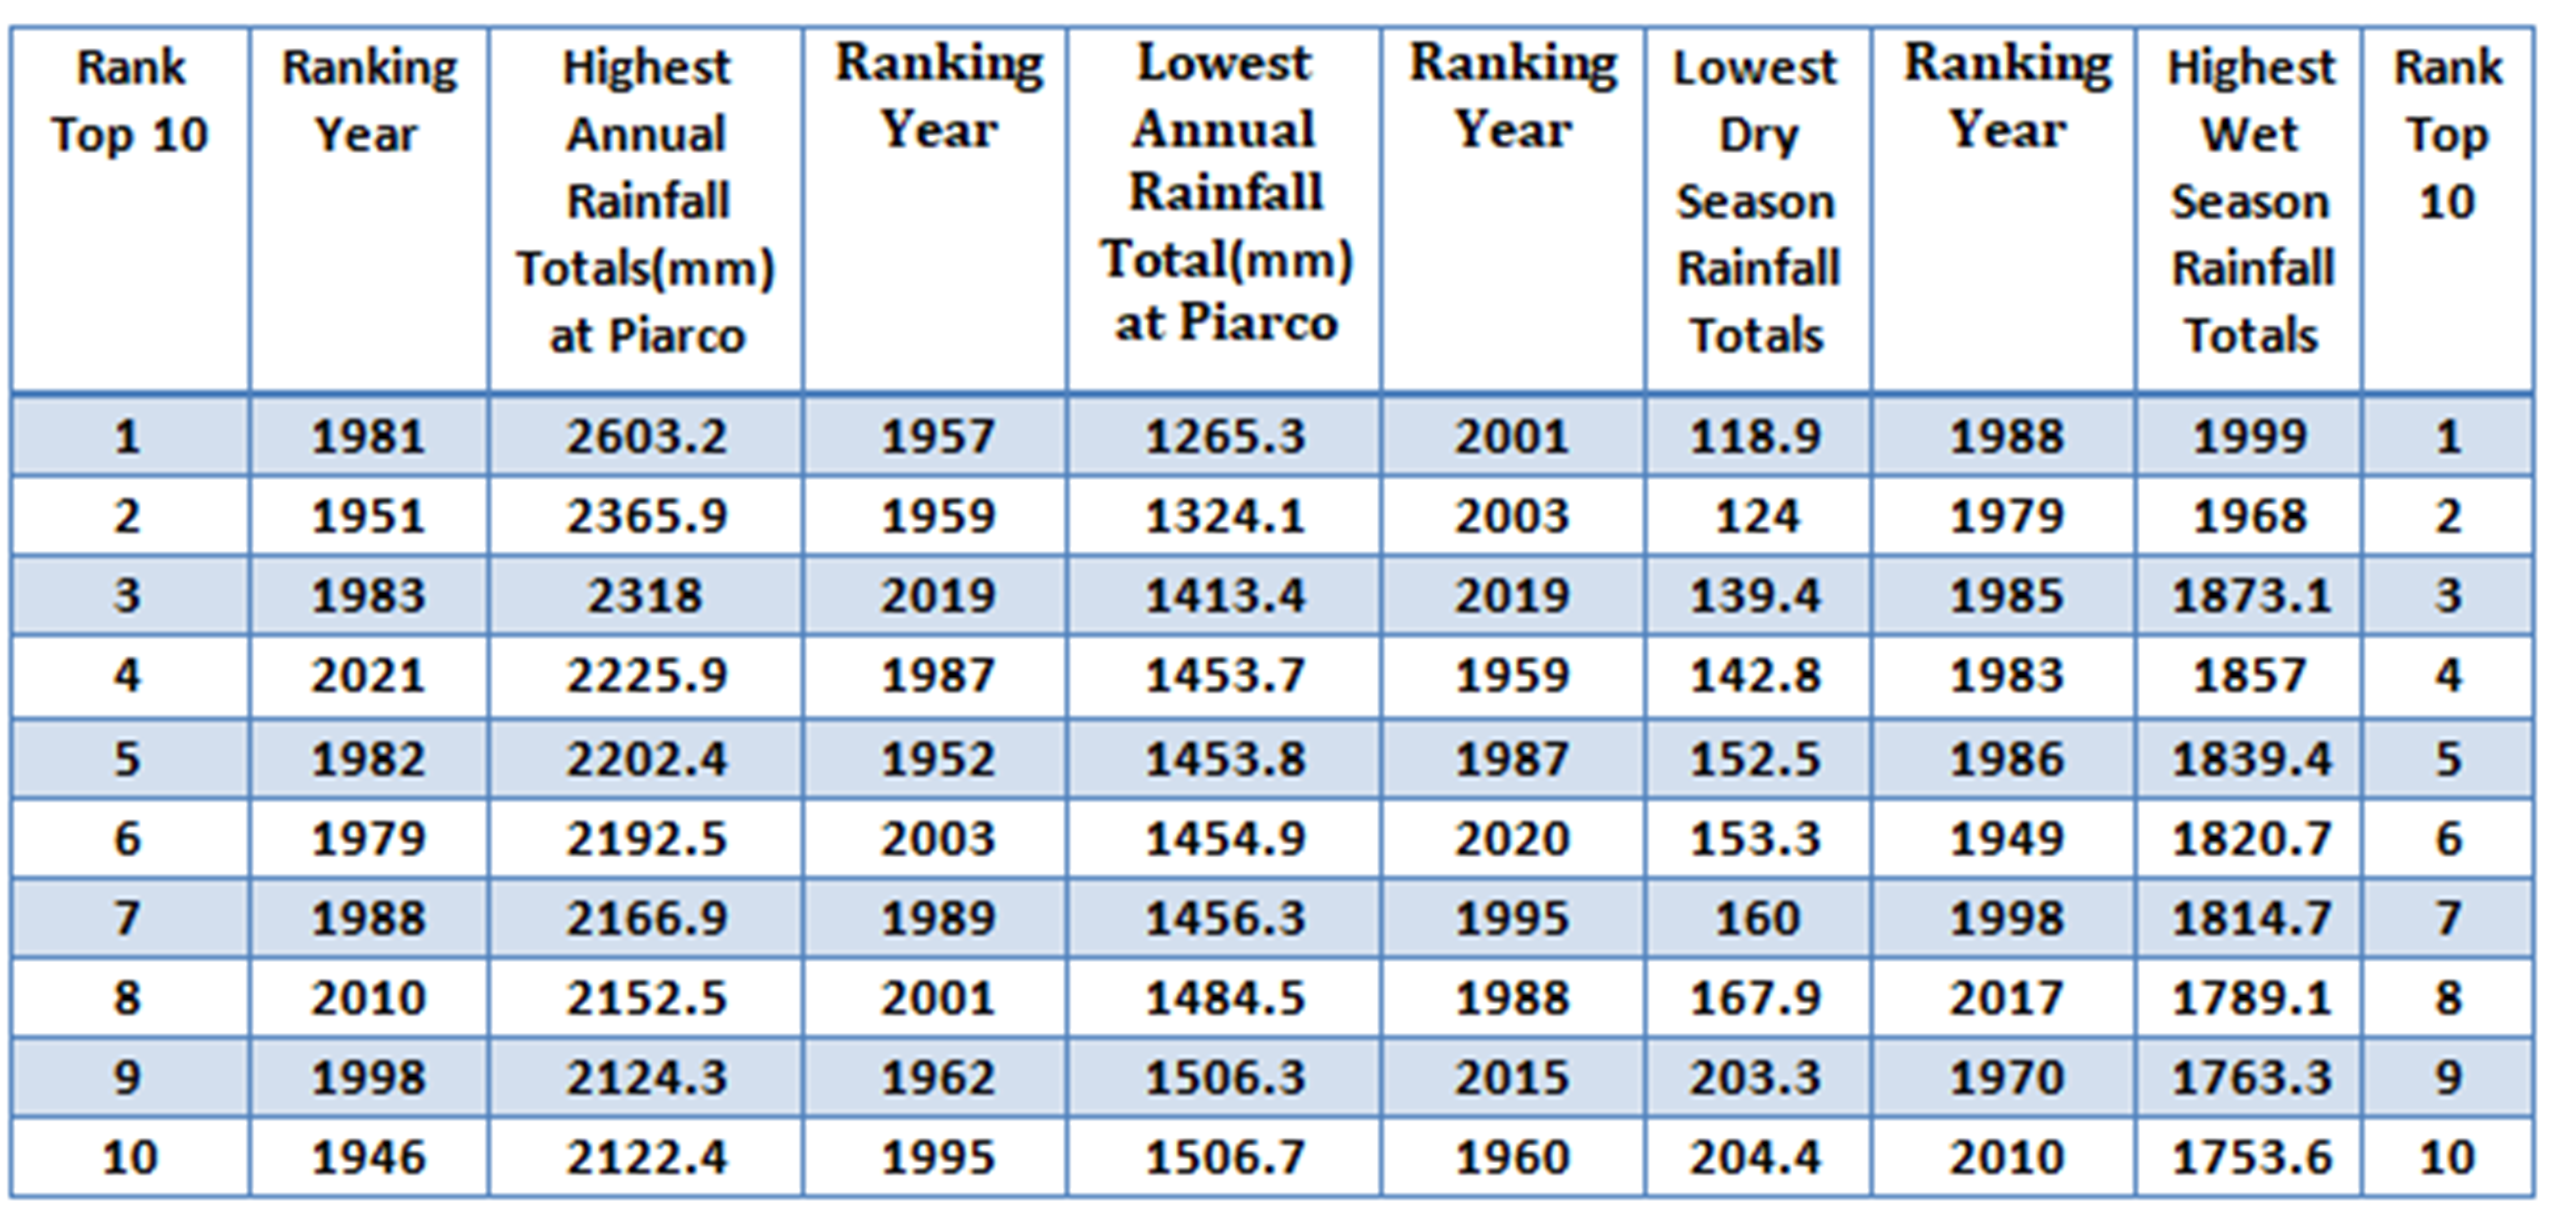
RAINFALL RANKINGS - PIARCO
The table displays the top ten highest and lowest annual, wet and dry-seasons rainfall records at Piarco, Trinidad, showing the extreme variability in rainfall patterns.
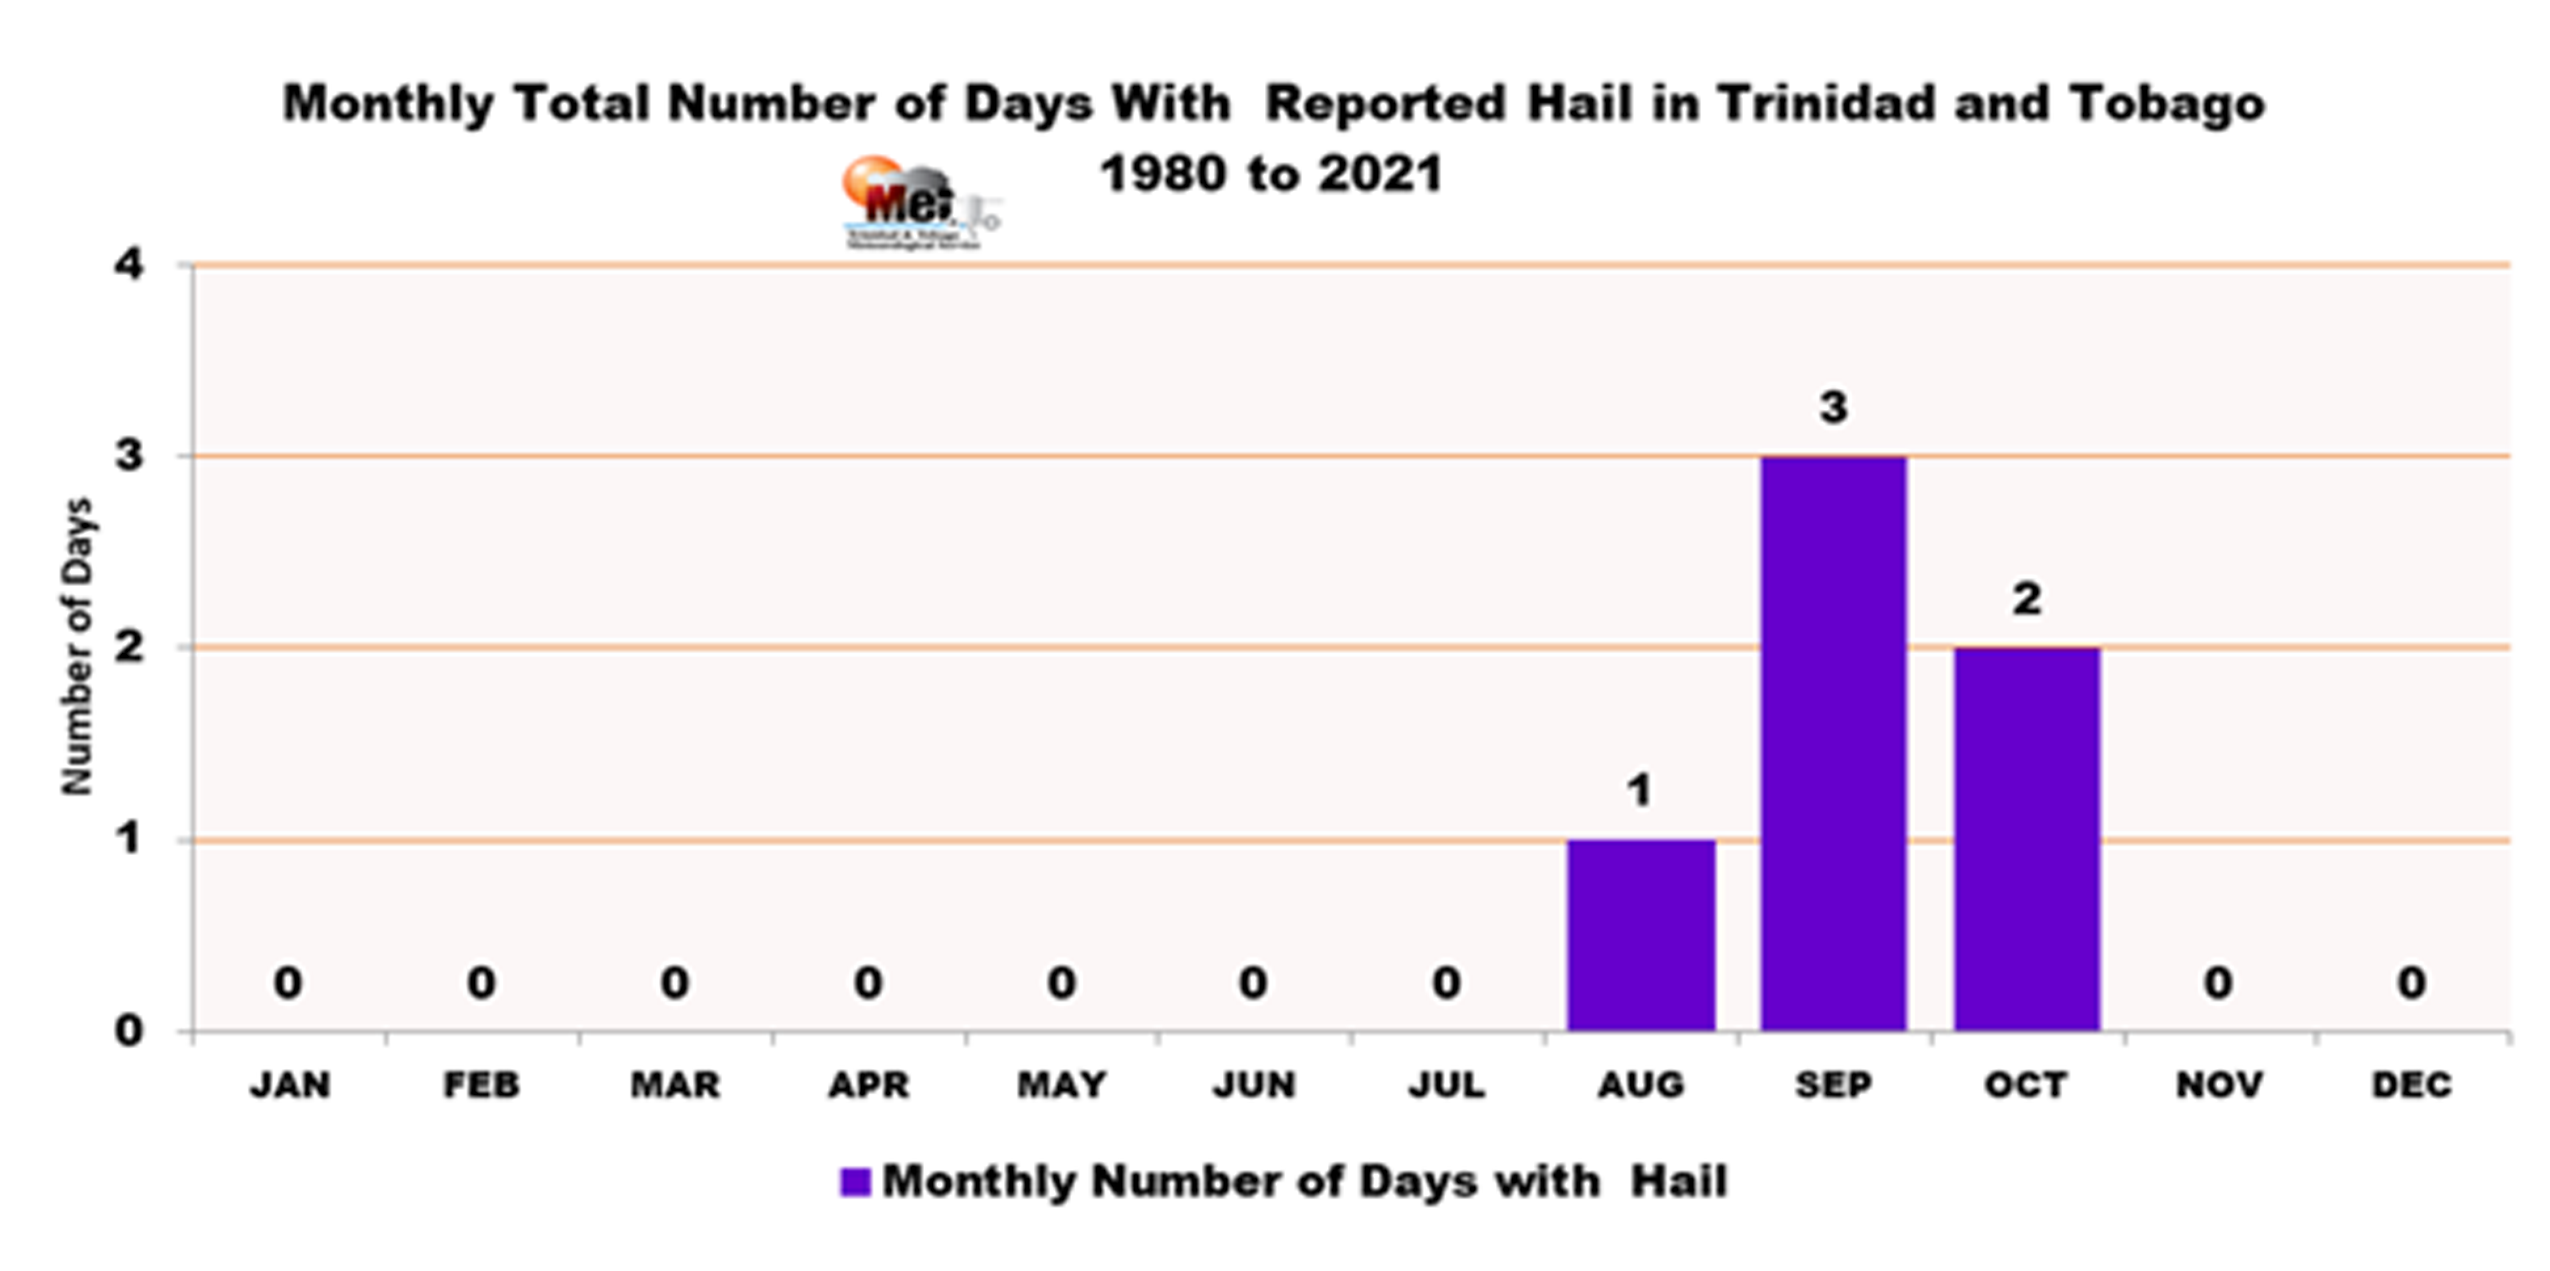
HAIL EVENTS OVERVIEW
This hail climatology report was obtained from the Meteorological Services Division (MSD) records. It will assist with understanding when a hail event is most likely to occur and when a rare event occurs. There have been 6 reports of hail occurrences that have been verified by the MSD in Trinidad and Tobago since 1980. The number of hail reports rose steadily over the years, doubling from 1 in the 1980s to 2 in the 1990s and 3 in the 2020s. The last two years had 3 reports, 2 in 2020 and 1 in 2021. N.B. These are events that the Meteorological Services Division has in its records. There may have been other events reported but were not verified or recorded by the MSD.
Hail Events Table
See table below for detailed hail event records
| Date | Location | Time | Maximum Day Temperature |
|---|---|---|---|
| October 29, 1985 | Diego Martin Valley | After Lunch | 32.0ºC |
| September 2, 1990 | Southern Cunupia (about 3 km south of Piarco) | After Lunch | 33.7ºC |
| August 12, 1996 | La Romain, San Fernando, Penal | After Lunch | 33.5ºC |
| September 08, 2020 | Carlsen Field, Central, Trinidad | 2:45 pm to 3:15 pm | 33.8ºC |
| October 17, 2020 | Piarco, North Terminal | 2:00 pm | 33.1ºC |
| September 27, 2021 | Tacarigua, Trincity, Arouca | 1:20 pm to 1:40 pm | 33.8ºC |
HAIL FREQUENCY PATTERNS
Not surprisingly, 50% of the hail reports in Trinidad and Tobago occurred in September with the remaining 50% occurring over August and October. These three months are both the warmest months of the wet season and the months with the lightest winds on average. September is the warmest month on average in the year and also the record holder for the hottest day on record.
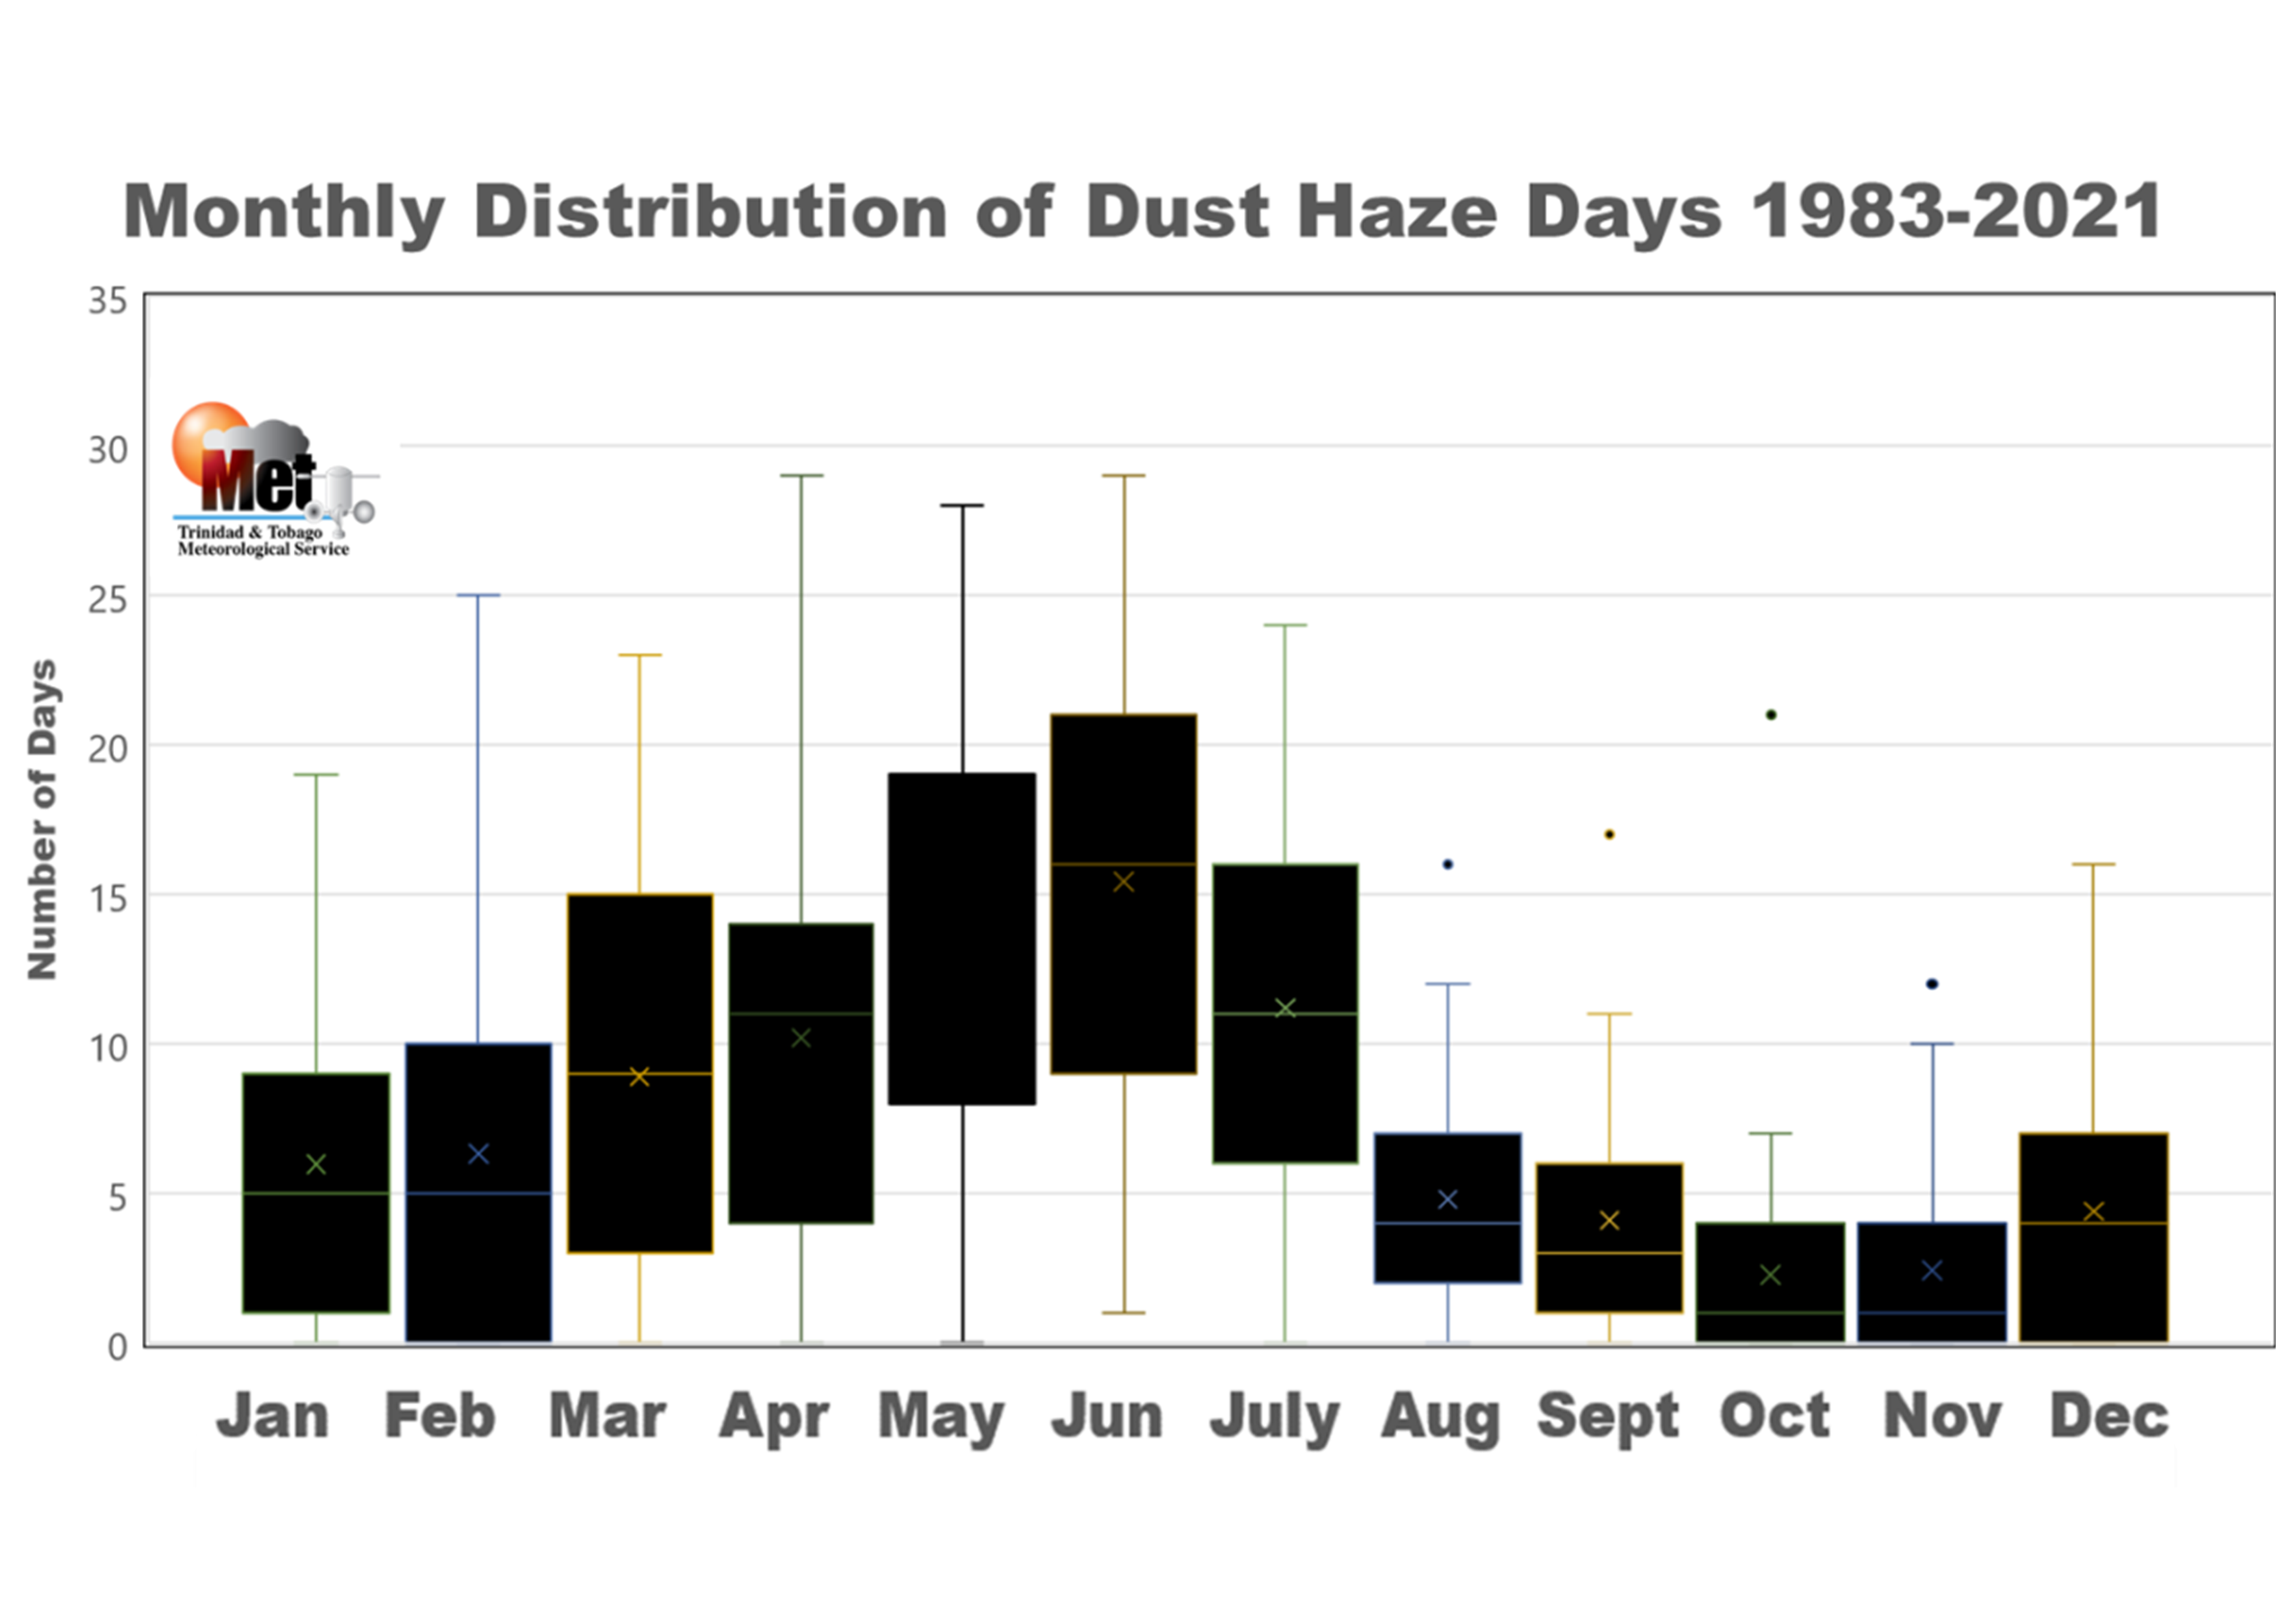
DUST HAZE CLIMATOLOGY
This graphic shows the monthly distribution of dust haze days for Trinidad and Tobago between 1983 and 2021. Monthly average Saharan dust haze days and frequency varies significantly, but the proportion of dust haze days is highest in June followed by May and July. This period is the peak of the local Saharan Dust Haze season.
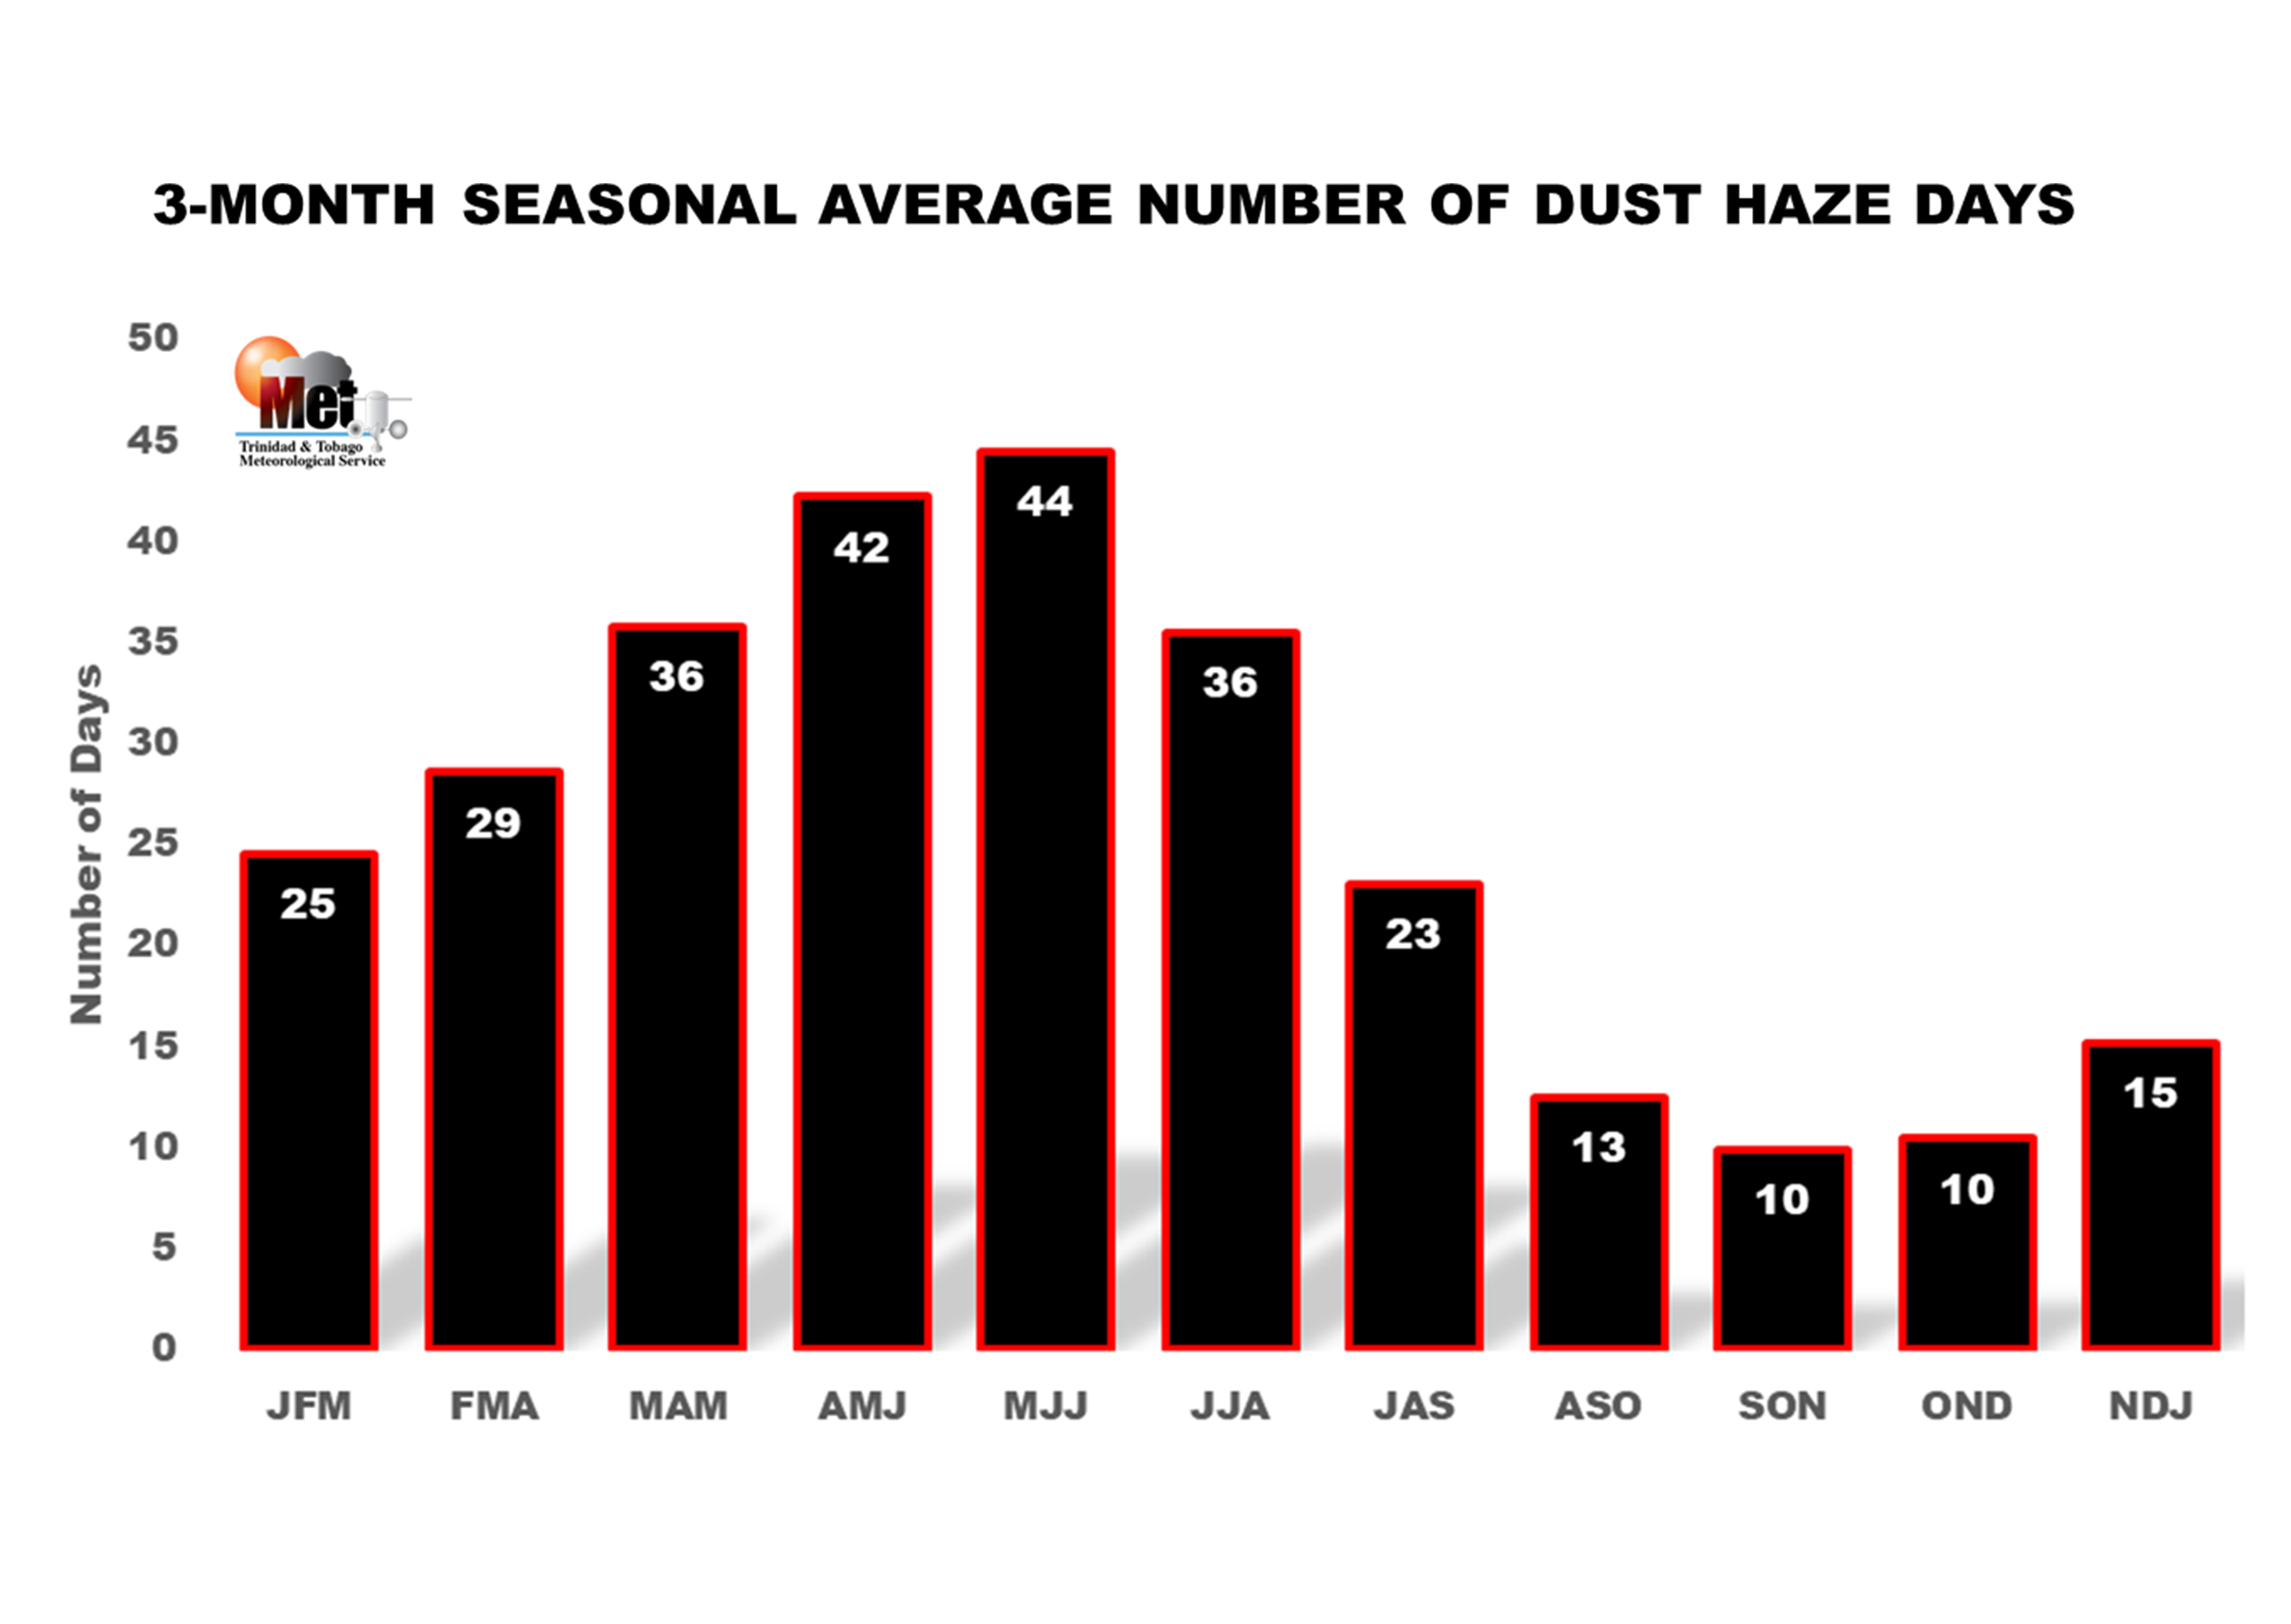
DUST HAZE SEASONAL PATTERNS
Long-term averages of the number of dust haze days for 3-month seasons are shown in this graph. The peak of the local Saharan Dust Haze season is May-June-July, which on average gets 44 dust haze days.
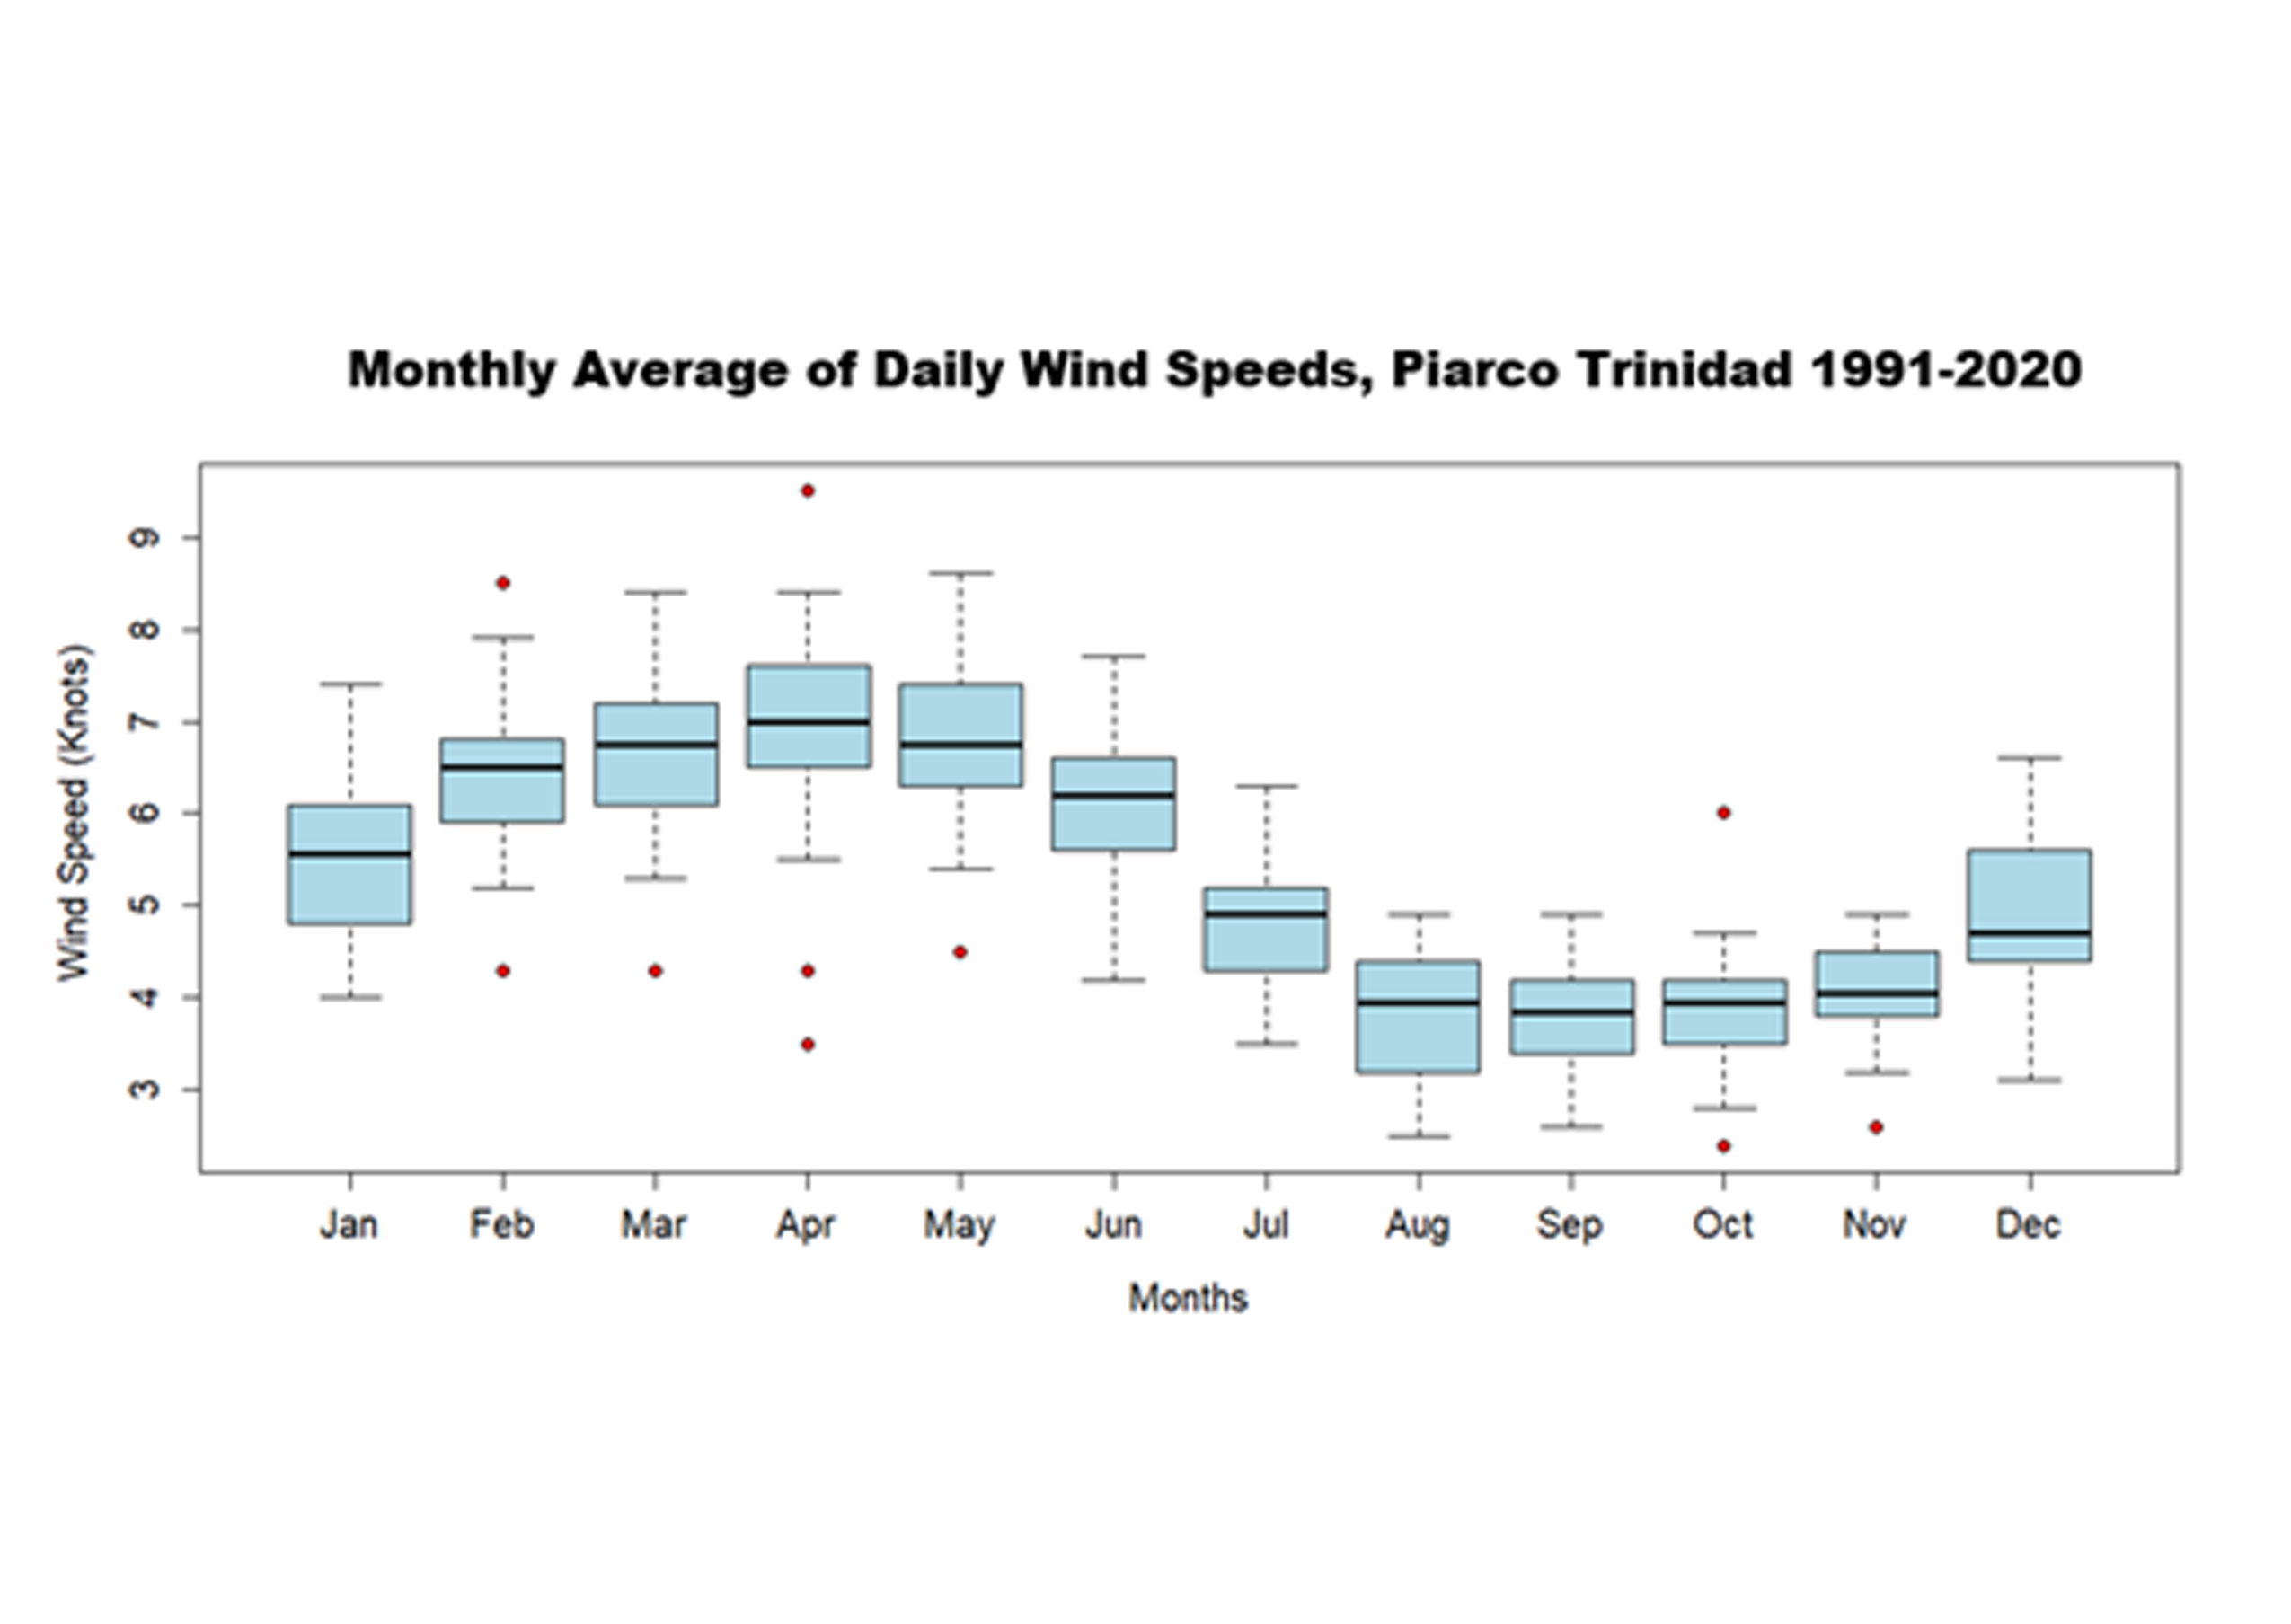
MONTHLY WIND SPEED PATTERNS
The boxplot of monthly averaged surface wind speeds (1991–2020) at Piarco shows that April typically has the highest average wind speeds, while September has the lowest. The dry season (March to May) generally experiences the strongest winds, while August to October, during the wet season, has the weakest winds. The minimum and maximum values are represented by the whiskers, with the mean, 25th, and 75th percentiles marked within the box. Other station records are excluded due to discrepancies in record lengths.
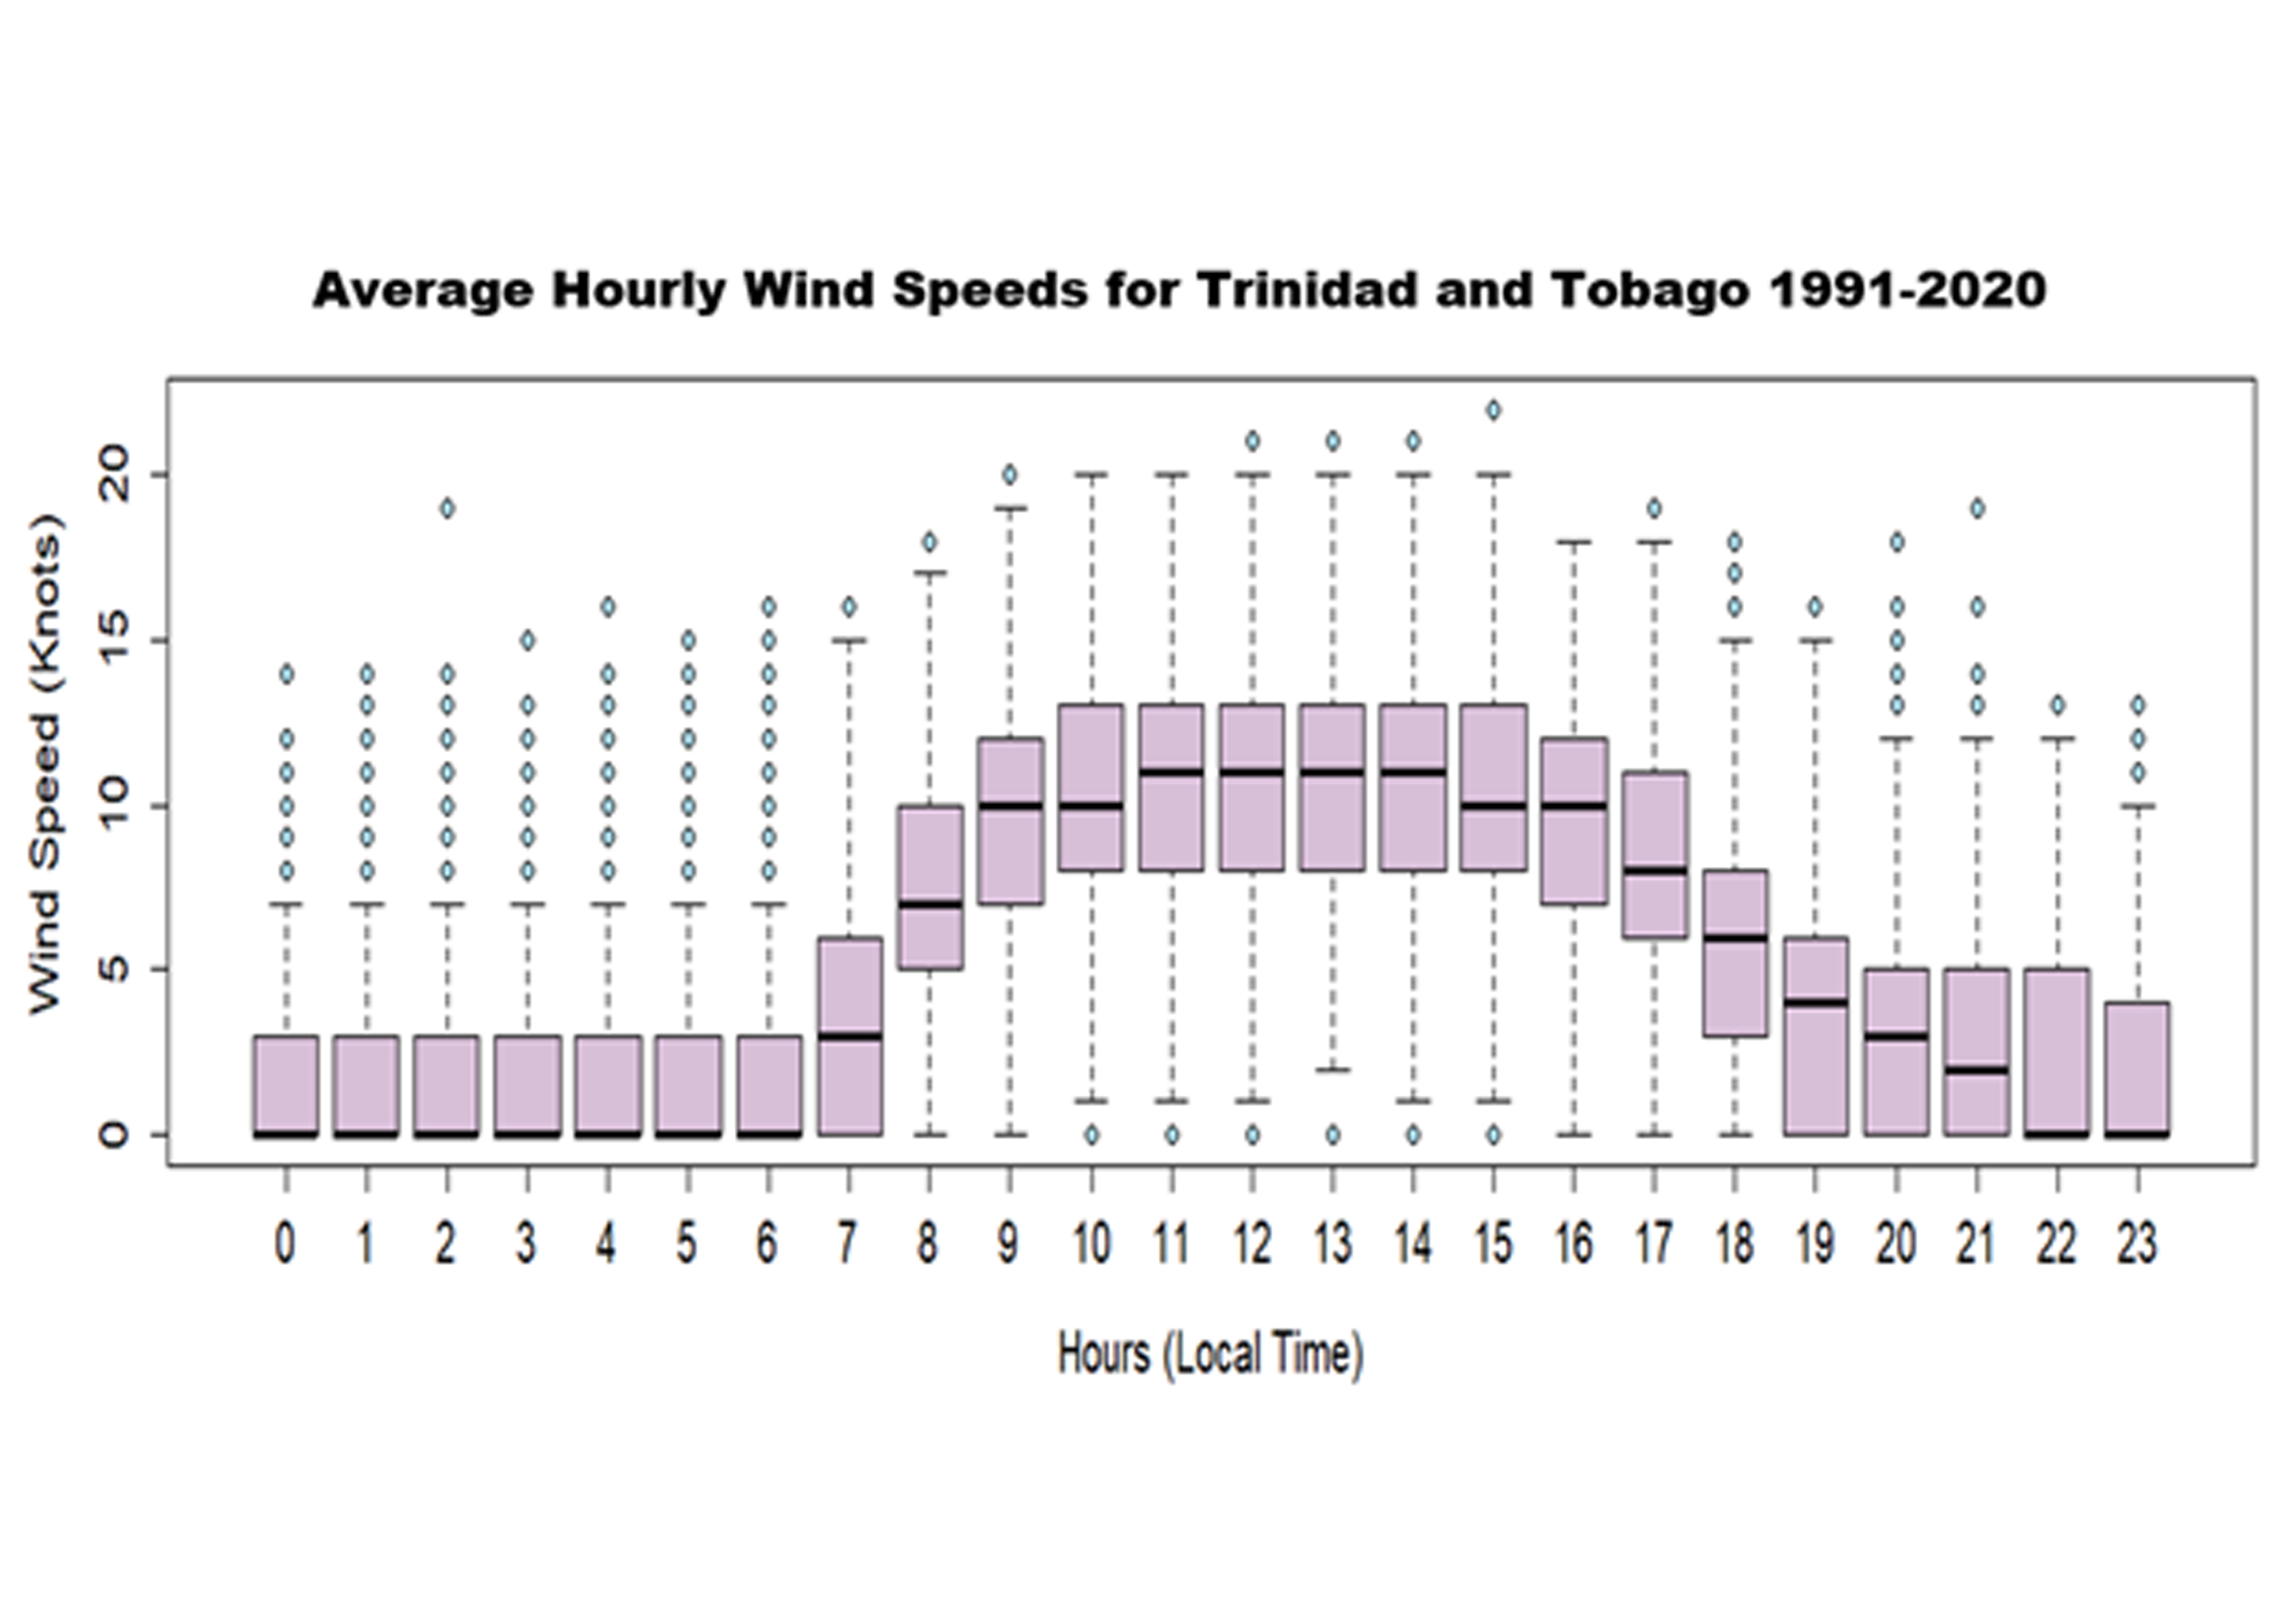
HOURLY WIND SPEED OBSERVATIONS
This graphic shows a boxplot of hourly mean wind speeds for Trinidad from 1991 to 2020. Hourly surface wind speed observations measured at the standard 10-meter height at the Piarco Meteorological Office over the period 1991-2020 show on average, the wind speeds to be strongest between 11:00 am and 2:00 pm and lowest between midnight and 6:00 am. Hourly extreme wind speeds can exceed 20 knots during the day.
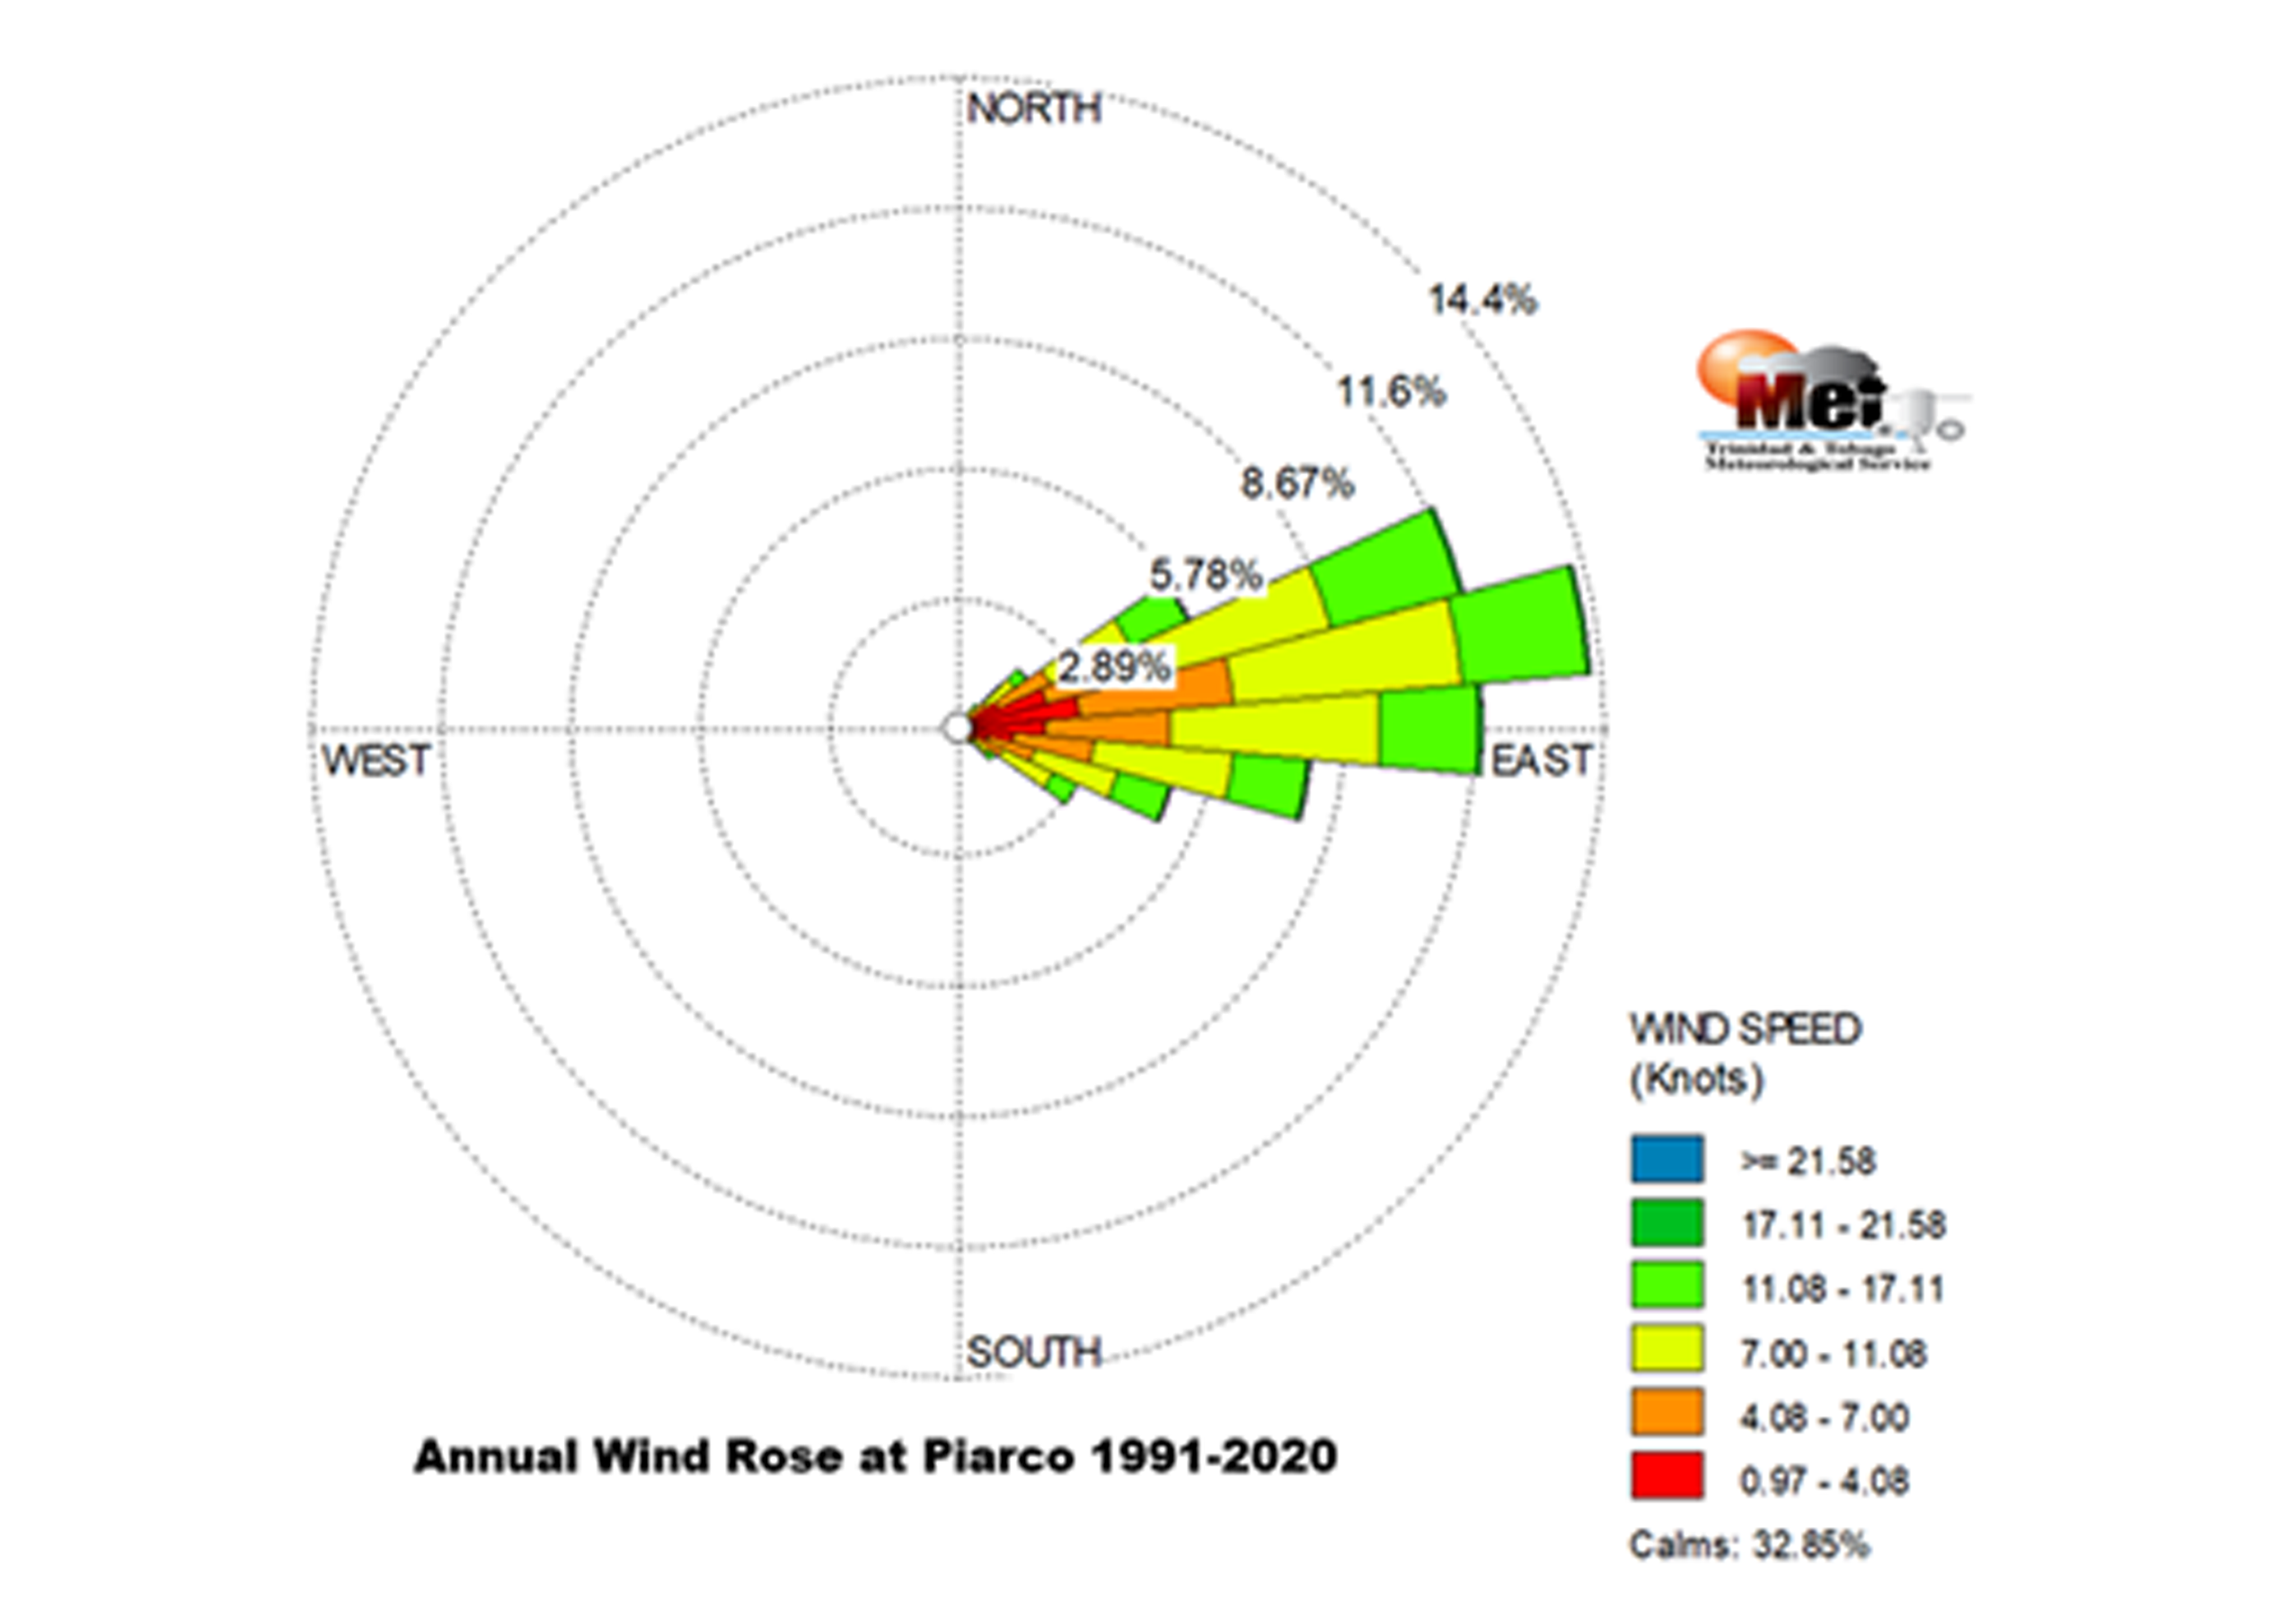
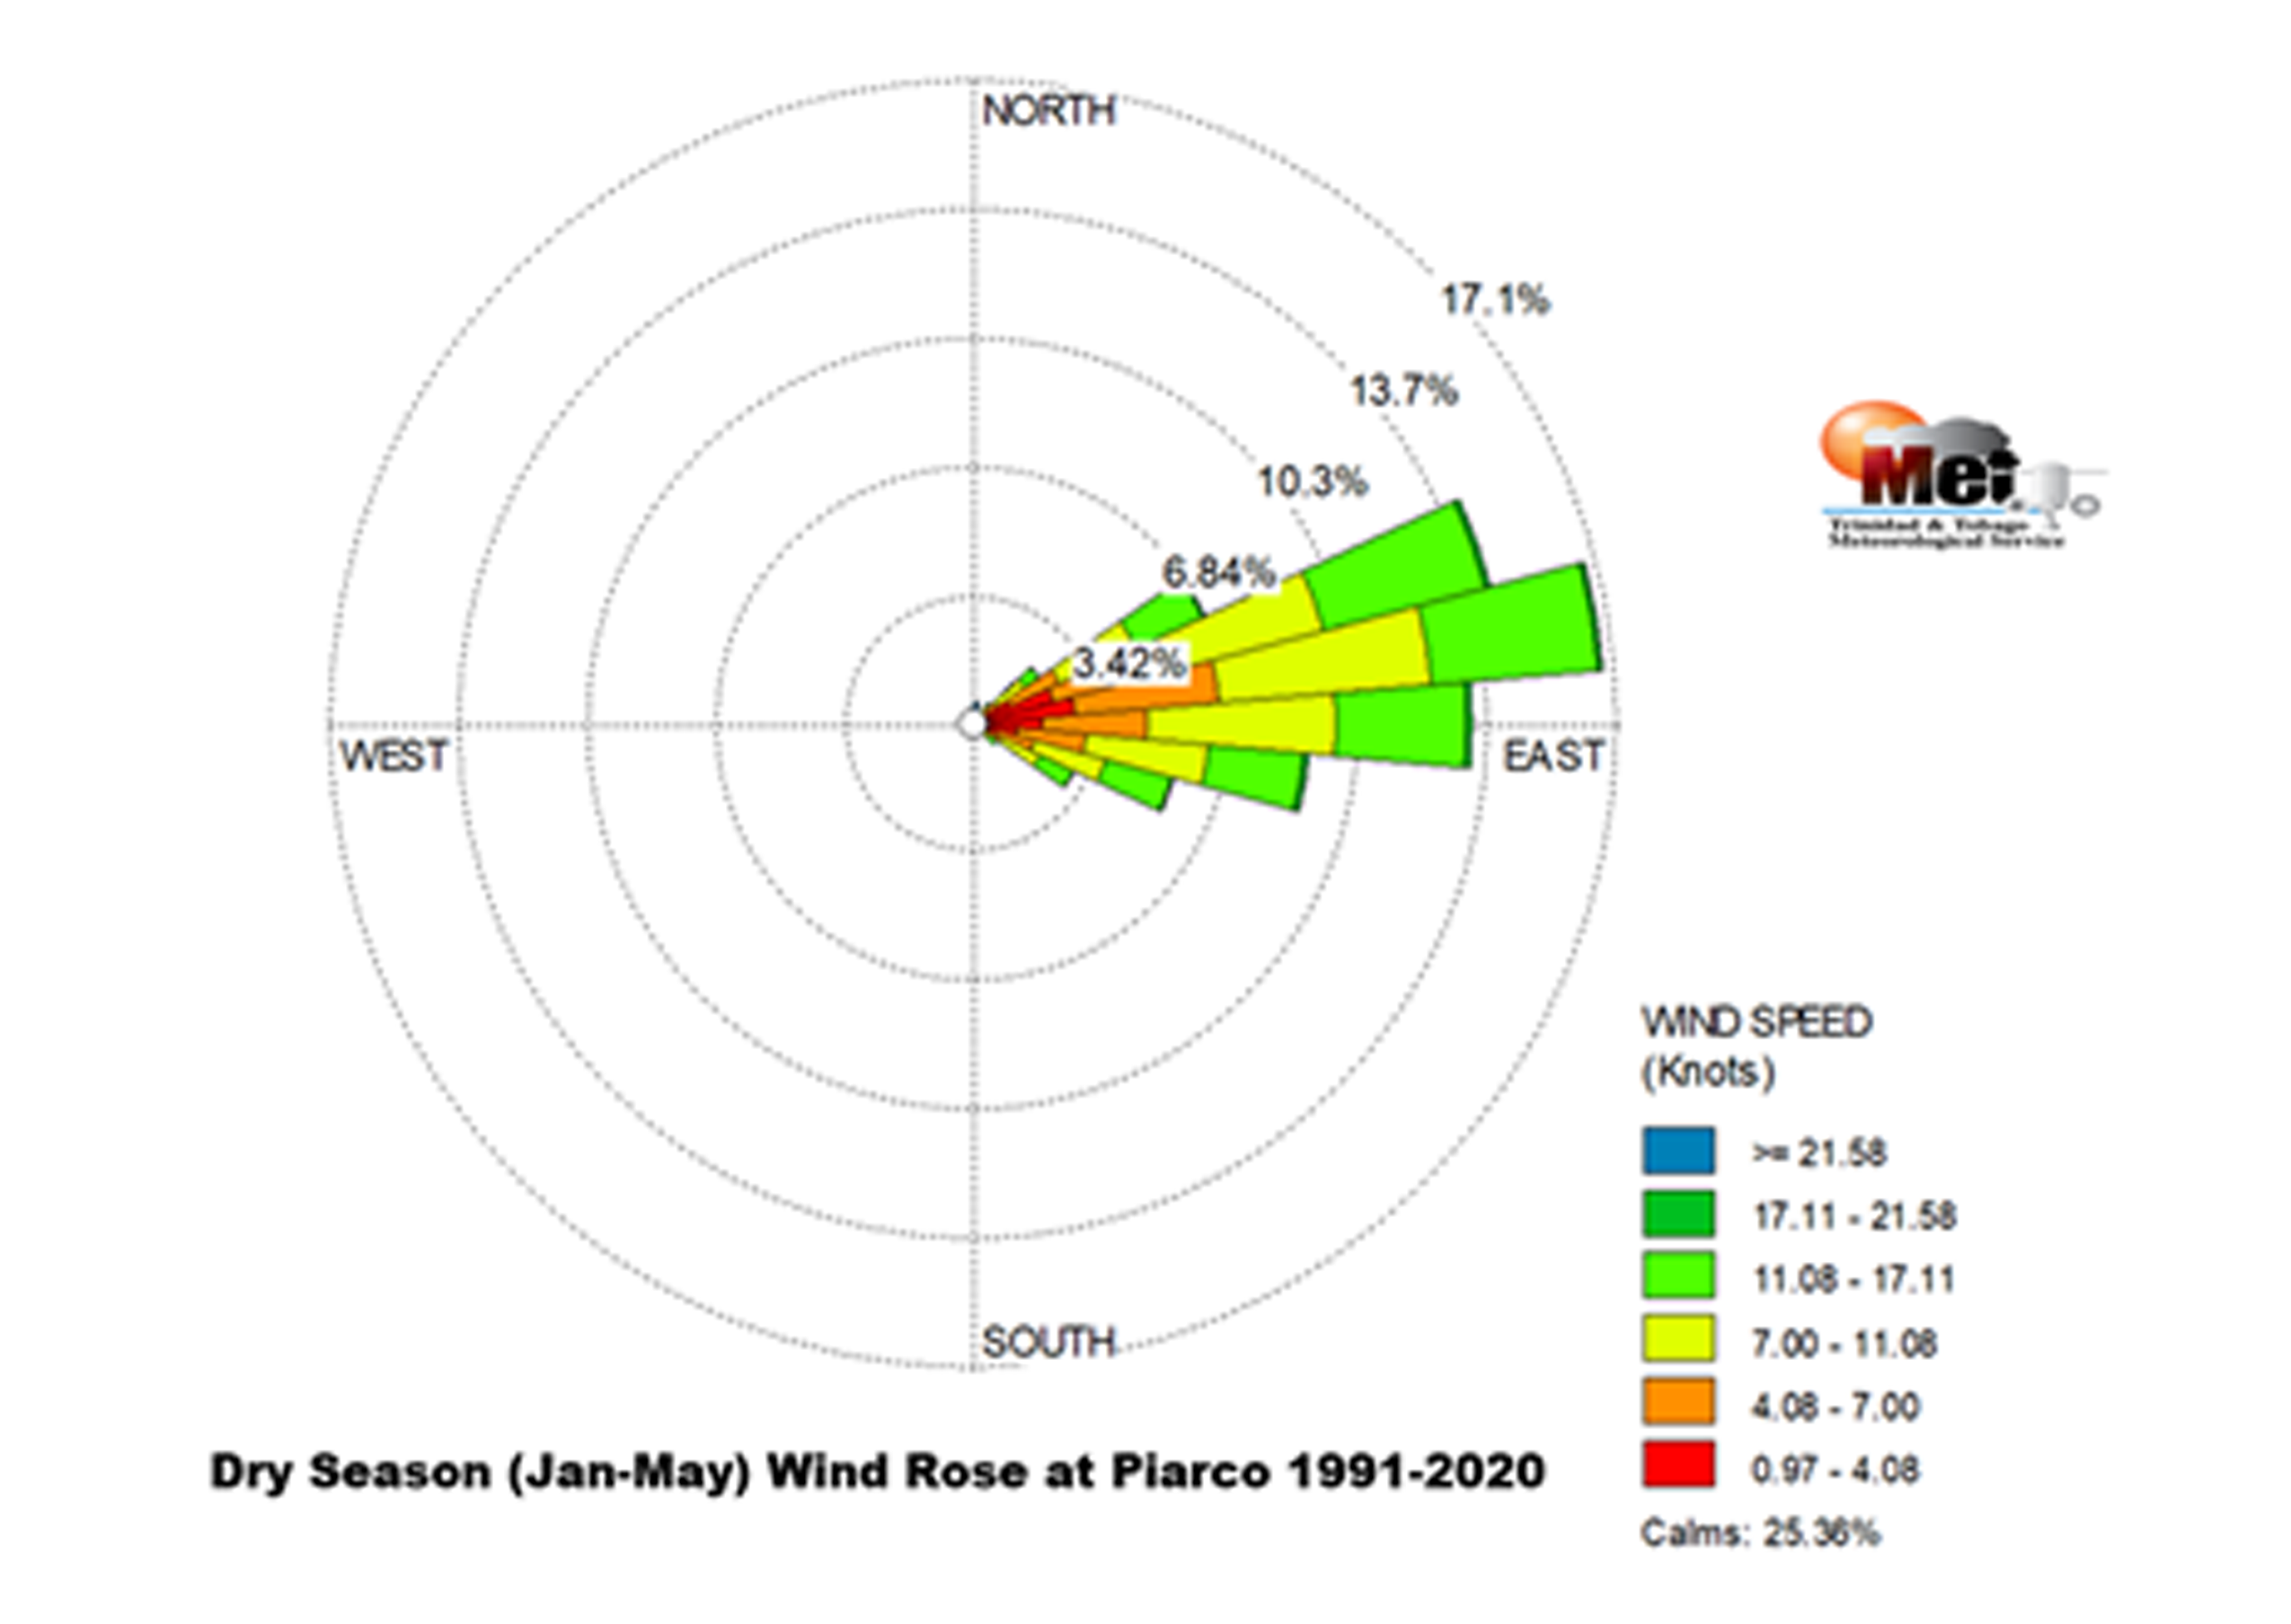
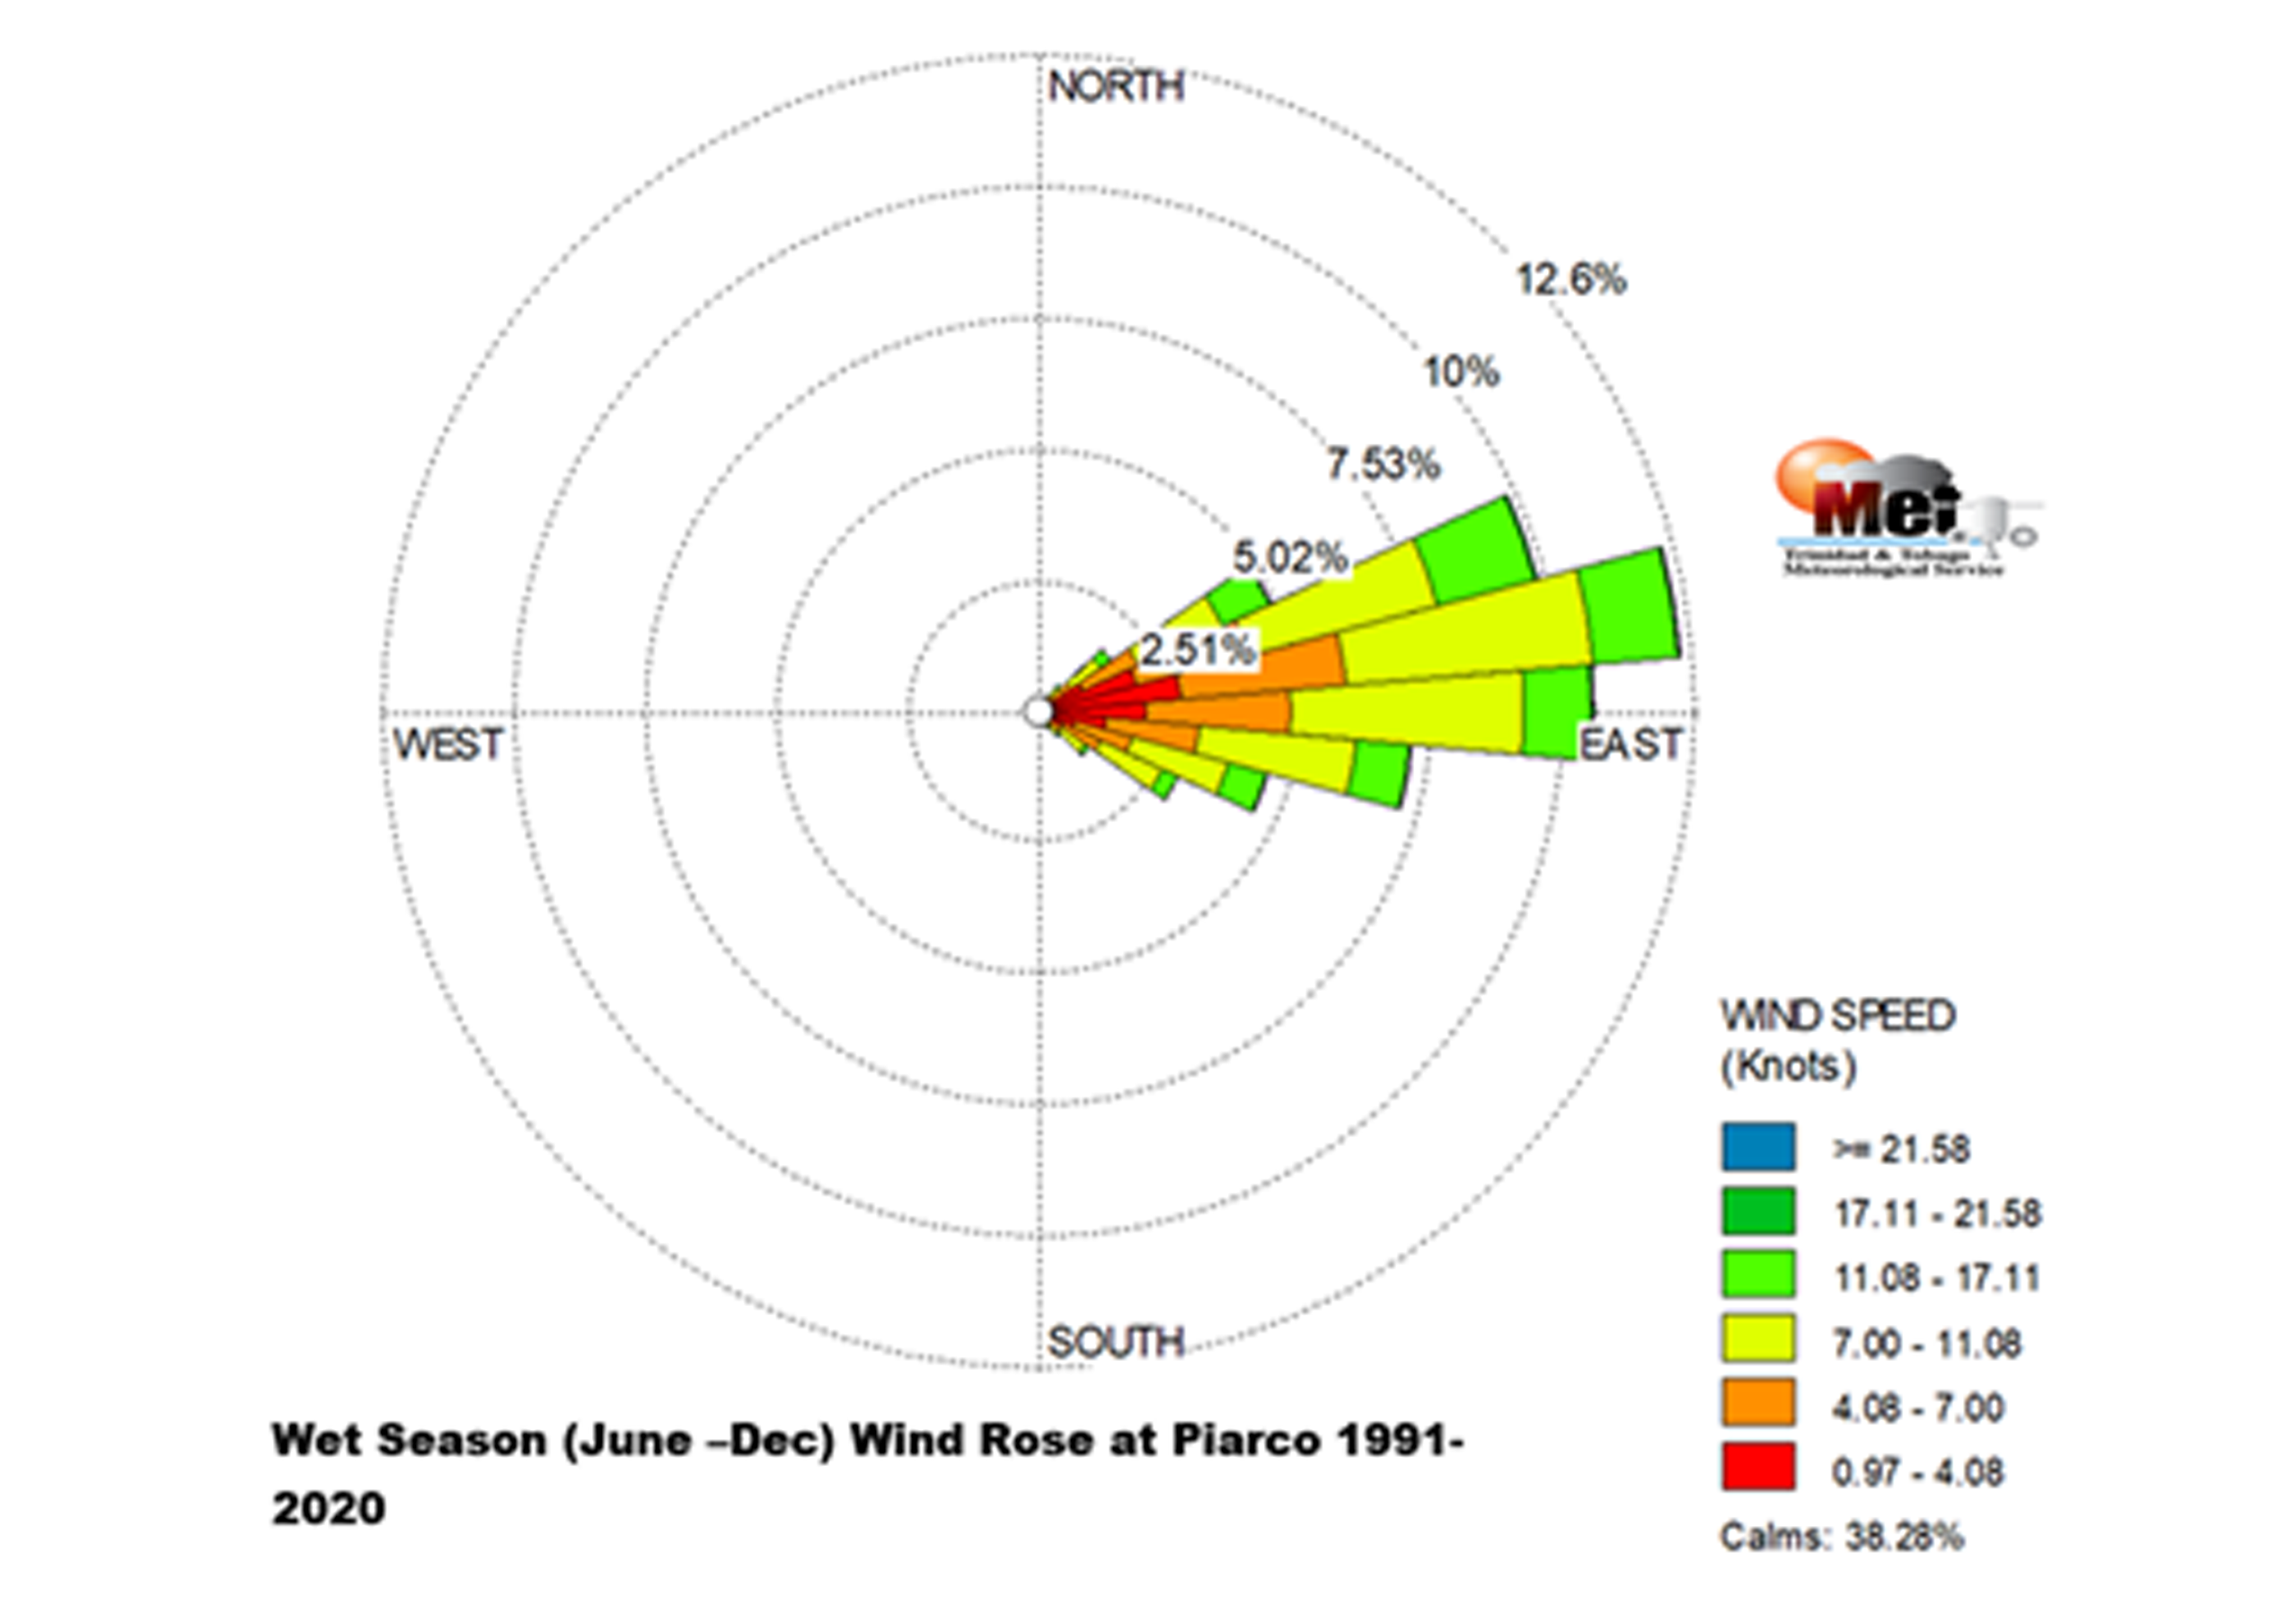
WIND ROSE ANALYSIS
These wind roses, graphically show the predominant wind direction and speed of the wind in Trinidad and Tobago and provide the best information regarding the percentage of time each wind direction and speed can be expected when averaged (standard climate normal 1991-2020) annually and at the dry and seasons scales in Trinidad and Tobago.
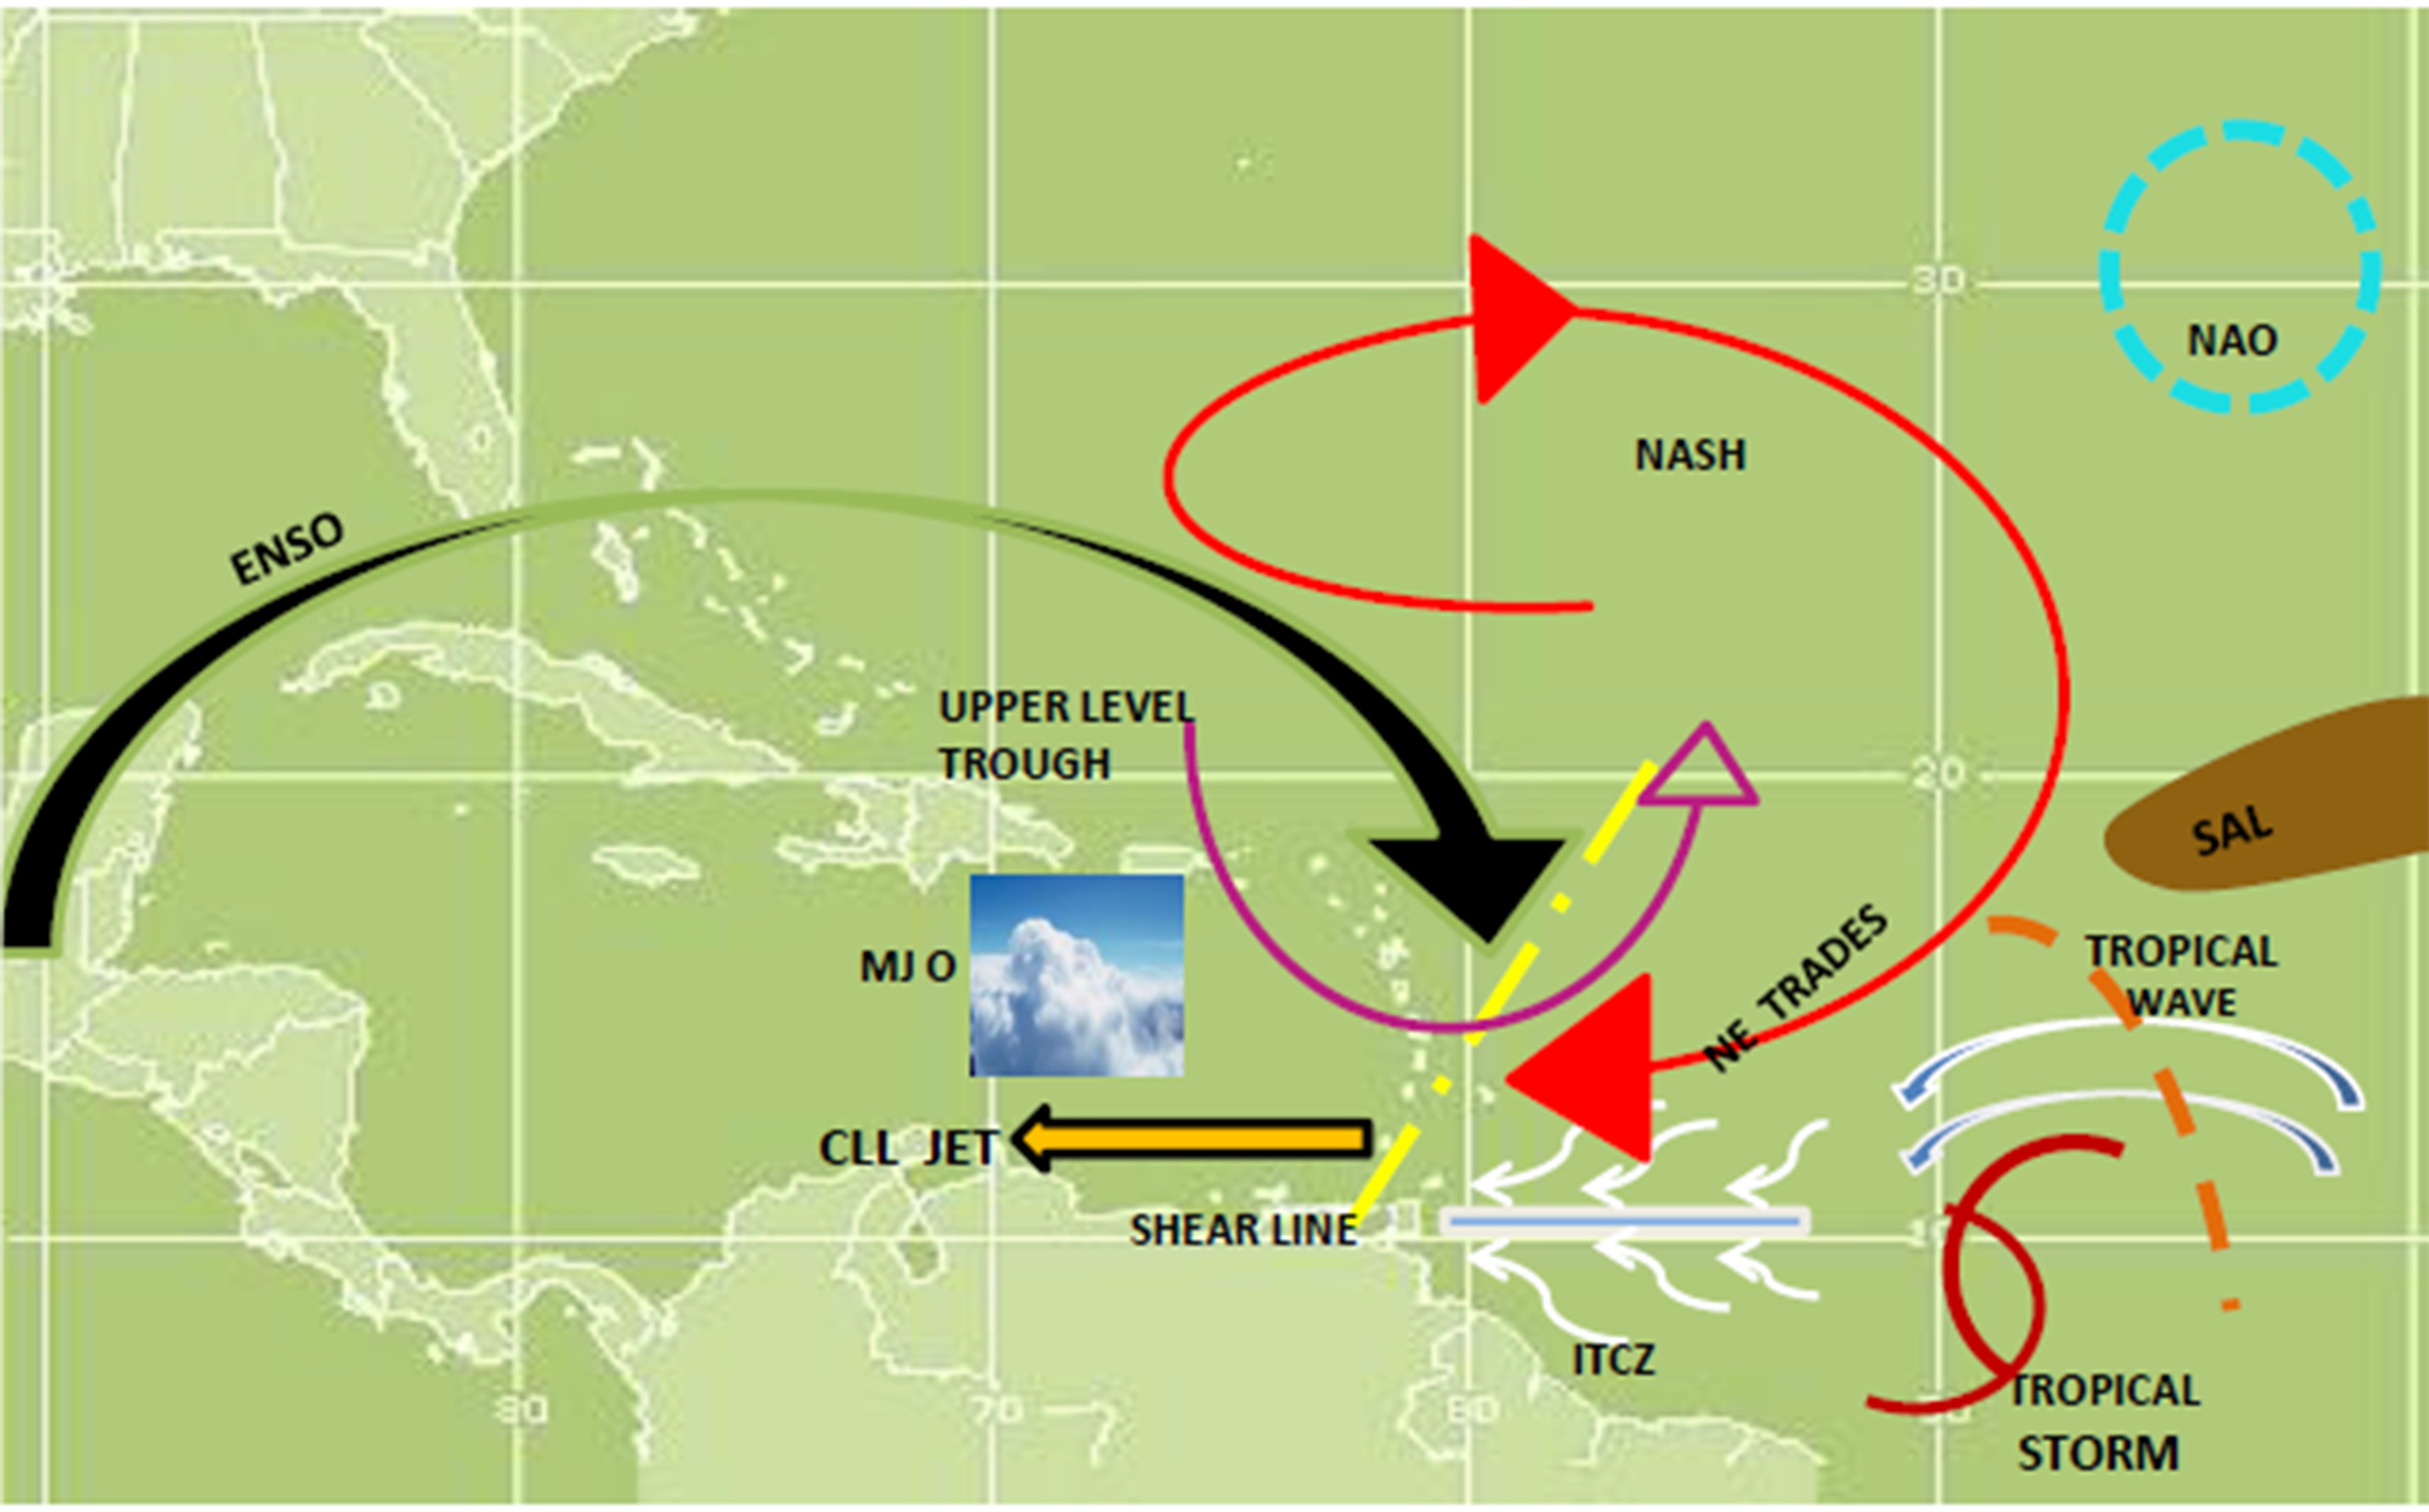
CLIMATE VARIABILITY DRIVERS
Trinidad and Tobago's climate has high year to year and seasonal variability, with rainfall having large spatial and temporal variability, over relatively small areas. The main drivers and influencers are presented in the schematic, but these are not all the influencers. The schematic represents the main drivers of rainfall and temperature variability over Trinidad and Tobago. These include the El Niño Southern Oscillation (ENSO), North Atlantic Sub-tropical High Pressure system (NASH), North East Trades, North Atlantic Oscillation (NAO), Inter-Tropical Convergence Zone (ITCZ), Madden Julian Oscillation (MJO), Caribbean Low Level Jet (CLL), Tropical Upper-Tropospheric Trough (TUTT), Upper Level Trough, Shear Lines, Tropical Waves, Tropical Cyclones and Saharan Air Layer; but these are not all the influencers.
MONTHLY RAINFALL
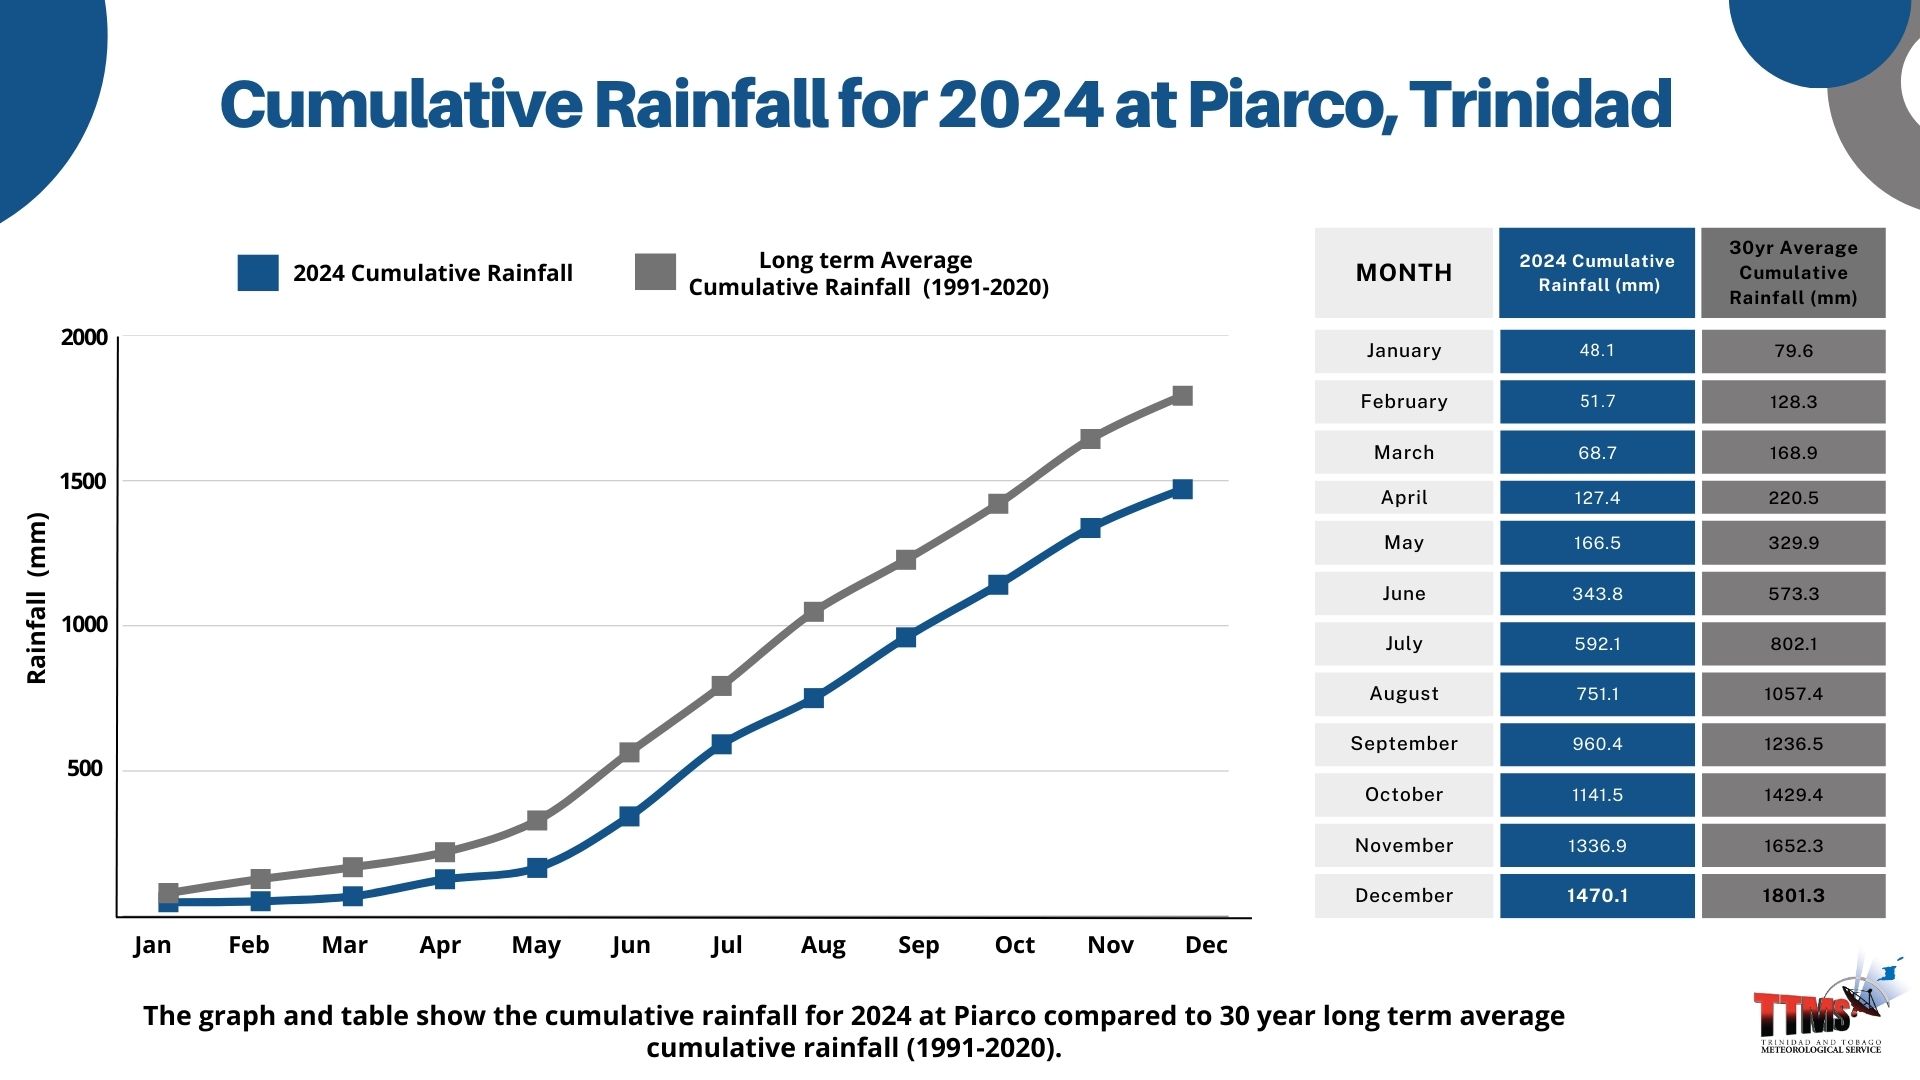
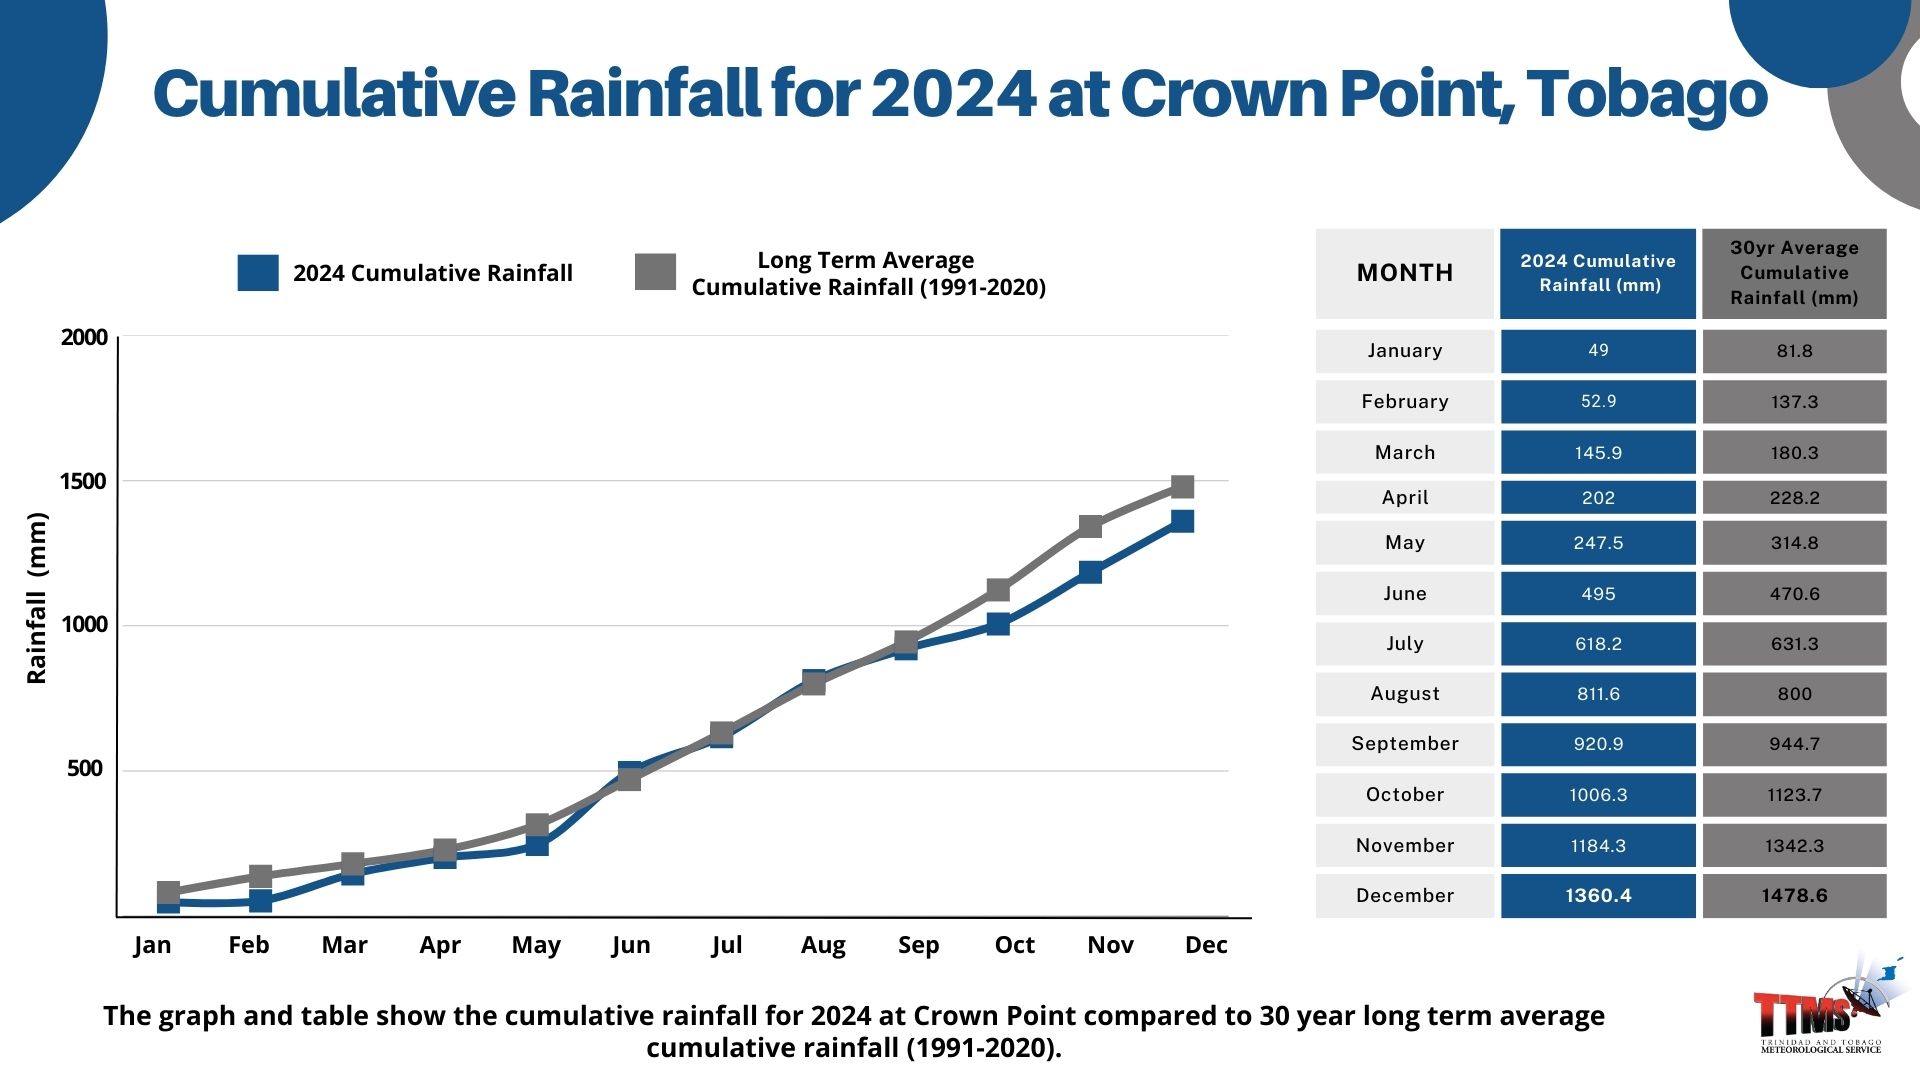
The Cumulative Rainfall graph shows the total amount of rainfall accumulated over a calendar year in comparison to the cumulated rainfall of the long term average, (the climatological standard normal).
Meteorologists and Hydrologists use such graphs to help visualize how rainfall accumulates over time, whether daily, weekly, or monthly.
It is useful in climate studies for comparing rainfall patterns across different seasons or years.
This data aids in predicting water availability, which is crucial for resource management, agriculture, and flood forecasting.
The TTMS observes and records the ongoing rainfall amounts for surplus or excess rainfall amounts to assess seasonal changes and adjust seasonal and climate forecasts.
Barometer
A barometer measures the rising and lowering of pressure of the atmosphere. High pressure indicates clear weather; low pressure indicates less favorable weather.
Materials:
- A clear bottle with a neck (ketchup or vinegar bottles work well)
- A clear, narrow glass jar (to hold about 2 cups or 480 ml of water)
- Water
- Food coloring
- Permanent marker
Procedure:
- Remove all labels from the jar and bottle.
- Clean thoroughly. Invert the bottle into the jar, making sure the bottle does not touch the bottom of the jar.
- Fill the jar with enough water to reach just over the mouth of the Inverted bottle by an inch (2.5 cm) or so.
- Add a few drops of food coloring to the water.
- Release air bubbles from the bottle by tipping it gently.
- Using a permanent marker, mark the water level on the jar. Place the barometer in a shaded area.
- Throughout the week, observe the level of the colored water.
- The water level in the bottle should be high during good weather and low in bad weather.
Hair Hygrometer
Ever notice that when it's humid you have a Bad Hair Day? Hair increases its length when humidity increases. So curly hair frizzes and straight hair goes limp. From dry to humid, hair length can change by 3 percent. In this activity, we'll hook up a hair to a lever system and create a hair hygrometer to measure changes in humidity. Invented in 1783, the hair hygrometer was so reliable that it was not replaced by an electrical instrument until the 1960s!!!!!!
Materials:
- Empty milk carton
- Large sewing needle
- Broom straw, 2" long
- Scotch or masking tape
- A Cent 9" human hair, wiped clean of oil
- 4 thumbtacks
- Paper clip
- Dishpan
Procedure:
- Cut the carton so as to make a small horizontal slit near the top; insert the paper clip. (Fig.1).
- Cut a vertical slit near the bottom. Then cut horizontal slits perpendicular to this cut at its end points - like an H on its side. (Fig.1)
- Pry out the flaps thus made and bend them to an upright position. Insert the needle through these flaps. (Fig.2)
- Tie the hair to the paper clip, wind it around the needle, tape the cent to the other end of the hair, and let the penny hang over the end of the box, which should be lying on its side.
- Put a card with a scale on the side of the carton under the straw which has been pushed through the eye of the needle. (Fig.3)
- Place the hygrometer on a wet towel in a dishpan and cover with a damp cloth. After 15 minutes remove it from the cloth and set the straw at numeral 10 on the scale.
- Watch to see whether the straw moves. Since humid air causes the hair to stretch and dry air causes it to shrink, the straw should move toward the dry end of the scale as the hair dries.
Wind Vane
A wind vane, also called a weather vane, is a tool for measuring wind direction and was probably one of the first weather instruments ever used. Once you understand wind direction, you can determine which direction the wind is coming from. Weather vanes are usually found on top of buildings so they will catch an open breeze. Look for them on top of barns, houses, weather stations, hardware stores, and other places that sell or use weather tools. The part of the vane that turns into the wind is usually shaped like an arrow. The other end is wide so it will catch the smallest breeze. Sometimes a metal rooster or other animal sits on top of the weather vane.
Materials:
- 1 straw
- 1 straight pin
- 1 index card
- pencil with eraser
- tape
Procedure:
- Cut the point and tail of an arrow out of an index card.
- Tape them onto the ends of the straw.
- Push the pin through the middle of the straw.
- Stick the pin into the eraser of the pencil. Make sure the straw can turn freely.